Brexit not affecting Trump rally, but correction soon
Updated 6:47 a.m.
The Emini gapped above the 60 minute moving average. It also gapped above yesterday’s high, but immediately closed the gap. Yet, the bears were unable to get a quick move down. Furthermore, the bars are not big. Hence, this is therefore a balanced market in search of direction.
This trading range price action increases the chances of another trading range day. Furthermore, it increases the chances of a trading range for the 1st hour or two. The bulls need to hold above the 60 minute moving average. If they are successful, the Emini will then probably test last week’s high today or tomorrow.
The Emini is selling off slightly and is Always In Short. Yet, the bears need to break strongly below the 60 minute moving average. If so today could be a bear trend day. However, these early small bars and reversals within a 3 week range make a strong trend day up or down less likely. The odds therefore favor another trading range day.
Pre-Open market analysis
The Emini continued its 3 day pullback from the FOMC buy climax. While the bears hope that this is a reversal down from a lower high major trend reversal, the pattern is too small on the daily chart. The rally to last week’s high only had 4 bars. In addition, it was part of a 3 week tight trading range. Therefore, this selloff is more likely a continuation of that range than the start of a bear trend. Hence, the odds are that bulls will soon buy now that the pullback is getting low in the range.
Since the high on the weekly chart was unusually far above the weekly moving average, any rally will probably stall. Many bulls want a pullback to the weekly moving average before they will buy again.
Because this year’s rally has been strong, the odds are that the 1st reversal down will attract buyers. Therefore, the bears will probably need a test up and a double top before they can begin the selloff to the December close.
Overnight Emini Globex trading
The Emini is up 4 points in the Globex market after yesterday’s bull reversal. Yet, it has been in a 3 point tight range over the past 6 hours.
Because the Emini has been in a trading range for several weeks, the odds favor reversals every few days. Since it has sold off for 3 days, the bulls should probably get a bounce today or tomorrow. They need a breakout above the 60 minute moving average to begin a leg up.
In addition, there are not enough bars for a major top. Hence, the bulls probably will have to test last week’s high or the all-time high before the bears can get a reversal down to the December close.
EURUSD Forex market trading strategies
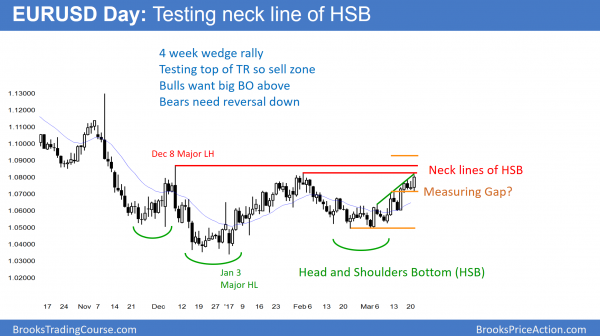
The 4 week rally on the daily chart has 3 pushes up. In addition, the 3rd push is subdividing and has a smaller 2nd push up within it. Because there is a gap after the 2nd push, there might be a successful break above bot lower highs.
The bears have a wedge rally on the daily chart. Furthermore, it is now testing the top of the 5 month trading range. This is therefore the sell zone. Yet, there is no reversal down yet. In addition, there is a gap up after the 2nd leg up. Hence, that gap might lead to a measured move up. Hence, it could lead to a strong breakout above the neck lines of the bottom. It could therefore then lead to a test of the November top of the huge bear reversal down.
Because the chart is still in a trading range, the odds still favor a continued trading range rather than a successful breakout. Yet, trading ranges often have small breakouts that fail before the next leg down begins. This is therefore an important area. It could lead to a 400 pip measured move up or a 300 pip sell off to test the March low. The bulls need a strong breakout to convince traders that the rally will continue up to the November 9 high.
Overnight EURUSD Forex trading
The EURUSD 5 minute chart is near its high, but has been in a 20 pip range for 4 hours. Since it is near the top of a 5 month trading range, the bulls need a strong breakout. Without it, the odds favor a swing down to test the higher lows of the past 3 weeks.
Since the momentum up in March has been strong and the bull channel has been tight, the bears probably will need a week or more of sideways trading before they can reverse the market down. Hence, the odds are for a trading range over the next week. Then traders will look for the big bull breakout or reversal down.
Summary of today’s S&P Emini futures price action and what to expect tomorrow
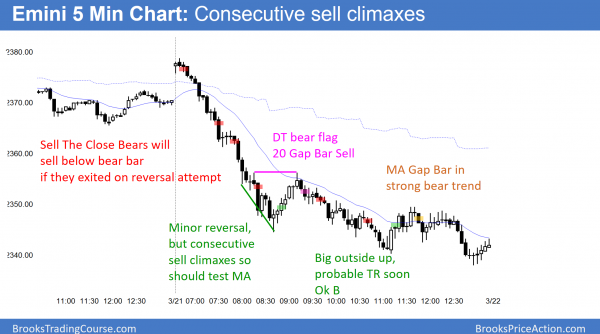
The Emini sold off strongly for 2 hours. It then evolved into a broad bear channel.
The selloff today broke below the 2351.00 neck line of the double top on the daily chart. In addition, there is a 60% chance of a selloff to below the December close within 2 months. Hence, tomorrow is important.
Since consecutive big bear bars would increase the chances that the sell has begun, tomorrow’s close is important. The bears want a gap down and a big bear bar, but the bulls want a bull bar. Yet, even if the bulls win, today was so dramatic that the odds are that there will be at least some follow-through selling over the next couple of weeks, even if there is a strong rally this week.
See the weekly update for a discussion of the price action on the weekly candlestick chart and for what to expect going into next week.
Traders can see the end of the day bar-by-bar price action report by signing up for free at BrooksPriceAction.com. I talk about the detailed S&P Emini futures price action real-time throughout the day in the BrooksPriceAction.com trading room. We offer a 2 day free trial.
When I mention time, it is USA Pacific Standard Time (the Emini day session opens at 6:30 am PST, and closes at 1:15 pm PST). You can read background information on the intraday market reports on the Intraday Market Update page.


Bar 1 opened at resistance, above the declining 60min average, and near measured move targets. The gap that formed between yesterday’s low (bar 70) and 1st major higher low (bar 77) was important. If you would had recognized and measured that gap you would have seen 2379 as the measured move target.
Remember what Al says, “close enough is enough if the context is right.”
If you go back to march 15th and draw a trend line from that day’s high (2387.75), extend it to the march 17th high (2382.25) and further, you would have seen that we gaped and opened up into a strong area of resistance. Or by your perspective at that time, the possible upper area of a trading range. After a few days of lower highs and lows, you should be aware when one side has more control over the other. Drawing trend lines will help remind you of these key signals.
Bar 2 today had a tail on top and closed near it’s low. Had you noticed the lower highs and or had the downward trend line drawn (of the past few trading days I just spoke of), you would’ve been open to the possibility of the market finding more sellers above then buyers.
In fact, the failed break out on bar 2 (tail) pushed up against the March 15th/March 17th extended trend line making the 3rd push up into this fairly new developing declining trend line i.e. bear wedge flag.
Bar 3 made a micro double bottom with bar 1 giving the aggressive bulls that bought the close of bar 1, and/or on a stop one tic above (high1 or 4 depending on your perspective) a sign of hope. By the close of bar 4, it should have been clear these bulls were in trouble. Some of the signals included a successful micro double top (bars 2 and 3), a give up bar (bar4), failed high 1 buy (bar 2), failed micro double bottom (Bars 1 and 3), failure for most bulls to get out break even, a MA gap bar failure, a give up bar(bar 4) with a shaved top while in a low 1 sell, and a bear wedge with the 3rd push poking just tics through a 5 day declining trend line.
Answer: By the close of bar 2, close of bar 4, or close of bar 7.
For traders using yesterday’s low as part of their trading range perspective (which would be extra aggressive given the context (all the bars to the left) bar 12. Bar 12 was the deal closer for the bulls. The market broke violently through yesterday’s low with ease and never traded back (Causing an important measuring gap, trapping even more bulls in).
*Remember what Al says; trade the “I don’t care” size to keep objective. “Do nothing”, and or to “wait” until it is clear. Then just accept the risk and let you’re “edge” play out.
Good Luck!
Johnny
Thank you!
Hi Al,
At what point of time was it obvious to you that this turned out into a bear trend day. It started as a trading range day and I was too late to realize that it wasn’t.
Thanks.