August stock market correction
Update around 7:11 a.m.
The Emini sold off to the 60 minute moving average and the bottom of Friday’s parabolic bull channel. Yet, the follow-through was bad. Limit order bulls and bears made money in the first 6 bars. This increases the chances of the trading range price action of the past 3 weeks will continue today. While most strong breakouts have had limited follow-through, most days have had at least one swing up or down.
Day traders need a strong breakout up or down with strong follow-through. Otherwise, they will be hesitant to hold onto positions too long. They will be quick to take profits. Therefore, this trading range mindset will perpetuate the trading range price action.
It is too early to know whether today will be a trend day. Yet, the odds are against a strong trend day because of the early trading range price action and the 3 week tight trading range. While the Emini is just now becoming Always In Long, the bulls need a lot more buying before traders will believe that a bull trend is underway. Otherwise the Emini might stay in a trading range for a couple of hours before there is a swing up or down.
Pre-Open Market Analysis
The Emini rallied to a new all-time high on Friday. While it broke above the 12 day tight trading range, the breakout was minimal. A trading range in a bull trend is a bull flag. As a result, the odds are that there will be more of a breakout. The breakout might last a couple of weeks.
Yet, this tight trading range will probably be the Final Bull Flag. As I wrote over the weekend, there is a 60% chance of a 40 point pullback and a 40% chance of a 100 point pullback in August. Hence, if there is a 5% pullback, it will test July 6 low.
That is well below the breakout point at the top of the 2 year trading range. It was the 1st pullback in the current Spike and Channel bull trend, which began in July. The Emini tries to test the low of 1st pullback, which is where scale in bears began to short. Because it is so far below, there is only a 40% chance of the Emini getting there without a more reliable top.
Emini Globex session
While the Emini is up 2 points and just below Friday’s all-time high, the bulls so far are unable to create a big enough rally that would probably lead to a gap up on the monthly chart. Friday was the 12th consecutive day in a tight trading range. The odds favor more trading range price action again today. Yet, there will probably soon be a big move down. There might be one more sharp move up first.
There is an adage in Wall St. that says when a small trading range forms just above a big trading range, the breakout will fail. Most sayings are true 40 – 60% of the time. Yet, this one makes an important point because it reminds traders that the current breakout above the 2 year trading range can fail. Therefore, traders need to be prepared for a reversal down. With all of the pundits on TV so extremely bullish, the sentiment is too positive. This means that the Pain Trade is down, and this reinforces my belief that there will be a scary reversal down in August.
While a bear trend is possible, a bull flag is more likely. I think that the current high will not be the final high. The odds are that there will be at least a test up from any August selloff before a Major Trend Reversal can form.
Forex: Best trading strategies
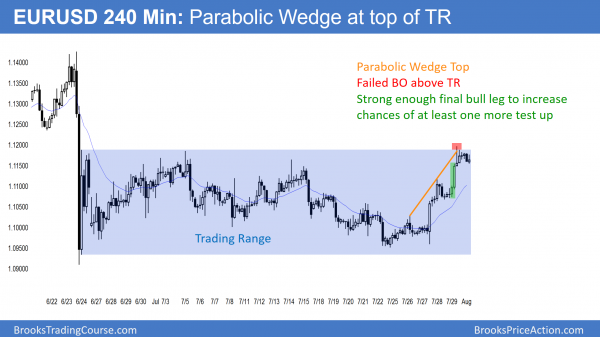
The 240 minute EURUSD Forex chart has a Parabolic Wedge Top. This could be a buy vacuum test of the top of the trading range. The final leg up was strong enough to give the bulls a 50% chance of a successful breakout. There is also a 50% chance of a pullback down into the middle of the range. If that happens, it usually initially begins with a 10 bar Endless Pullback before the bulls give up. Once they give up, they create a breakout. This often leads to a measured move down into the middle of the range.
The daily EURUSD chart reversed up strongly again on Friday. Yet, it only poked a little above the month long trading range. The bulls want strong follow-through buying today. If they get it, the next target is the June 24 sell climax high.
The bears want this rally to stall here at the top of the trading range. They then want a reversal down. They therefore see this as a double top bear flag.
Since the daily chart is now in the middle of its 2016 trading range, the odds are that it will enter a small trading range for a few days. This is because traders are quick to take profits after brief moves when the market is in a trading ranges. Reversals come quickly. As a result, traders are unwilling to hold onto their positions for swing trades.
European Forex session
After Friday’s strong rally to the top of the month-long trading range on the daily chart, the EURUSD Forex chart stayed in a 30 pip range overnight. The rally on the 240 minute chart from the July 24 low has 3 pushes up and is in a Parabolic Wedge bull channel. This increases the chances for a sharp pullback. However, the leg up on Friday was strong enough so that there will probably be at least one more push up before a pullback. Because the EURUSD is at the top of its month-long trading range, if there is one more push up, it might be small.
There is still the possibility of a strong breakout above the range, but when the bulls stop buying aggressively at resistance, as they have since Friday, the odds drop to about 50%.
Summary of today’s S&P Emini futures price action and what to expect tomorrow
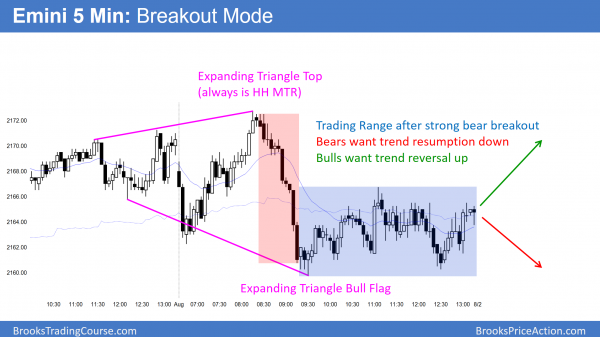
The Emini had an Opening Reversal up from the 60 minute moving average. After breaking to a new all-time high, it reversed down from an Expanding Triangle top. It spent the rest of the day in a tight trading range. It is therefore in Breakout Mode. The bulls want trend reversal up after the Expanding Triangle Bull Flag. The bears want trend resumption down after a strong 1st leg down today. Hence, they want a Leg 1 = Leg 2 measured move down.
I have been saying that August will probably close below its open because it follows 6 bull trend bars on the monthly chart. Today traded above last month’s high and reversed down. Today therefore might remain as the high of the month. While August will probably correct down 40 – 100 points, there is no clear top yet. There is also no strong bear breakout. Hence, the odds are that it will go at least a little higher before the correction begins.
Yet, today had a strong reversal down. This might remain the high of the month. The bears need a strong breakout below the 3 week trading range. Without that, the odds favor at least a little more up.
See the weekly update for a discussion of the price action on the weekly candlestick chart and for what to expect going into next week.
Traders can see the end of the day bar-by-bar price action report by signing up for free at BrooksPriceAction.com. I talk about the detailed S&P Emini futures price action real-time throughout the day in the BrooksPriceAction.com trading room. We offer a 2 day free trial.
When I mention time, it is USA Pacific Standard Time (the Emini day session opens at 6:30 am PST, and closes at 1:15 pm PST). You can read background information on the intraday market reports on the Intraday Market Update page.


Hi Al,
In the EU chart you have shared, if it make a DT around 1.118X region then will we start TBTL from the bar which poked above wedge and strongly reversed or from the bar which will potentially make a double top?
Many Thanks
Saad
It depends on where the strong reversal down begins. Without knowing, traders assume it will begin at the top of the rally.
Hi Al,
This is somewhat off topic, but I was wondering if I could get your opinion if you don’t mind. I’ve started trading individual stocks using your price action methods, but find myself also watching the E-Mini futures like a hawk during the trading day for any signs that the broad market may reverse, thus affecting my stock positions as a result.
I also do not watch the same stocks every day, but instead I frequently run stock screeners every day looking for stocks gapping up the morning, releasing strong earnings before the market open, etc. I am doing this because I am trying to find stocks more likely to trend during the trading day (because as a beginner I am looking for focus my attention on only trading with trend pullbacks).
Long story short, my question for you is do you think that I am adding too many layers here by a) allowing movements in the /ES to affect my individual stock trading decisions, and b) not watching the same group of stocks every day, but rather trying to find “hot” stocks to trade?
Thanks for all that you do. -Steve
When I day trade stocks, I trade them “stock specific.” I pretty much ignore everything else.
Lots of profitable traders watch a group of stocks and then trade the ones that have good setups. It is hard to do, but that one of the ways that traders have used to make money since markets began. Some traders make a lot of money doing it.