Monthly S&P500 Emini futures candlestick chart:
How to trade a breakout to an all time high
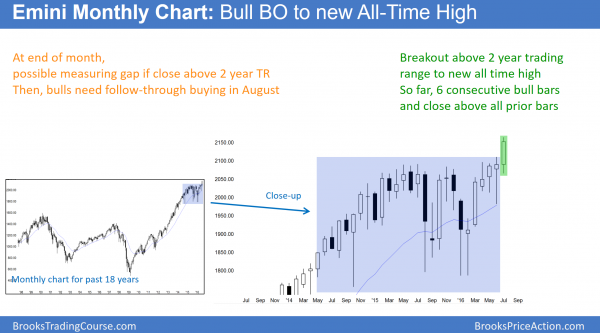
The monthly S&P500 Emini futures candlestick chart is breaking strongly above a 2 year trading range.
The monthly S&P500 Emini futures candlestick chart has a big bull breakout bar above a 2 year trading range. While there are still 2 weeks left to the month, this is good for the bulls. They want the month to close on its high and far above the range. They then want August to also be a big bull trend bar closing on its high. Finally, they want a series of consecutive big bull bars closing on their highs, like in 1994. The more signs of strength that the bulls create, the higher the probability of a big move up.
The odds are against them getting everything that they want. The bears know what the bulls want and they want the opposite. They therefore want July to reverse strongly and close on its low. Otherwise, they want other signs that the bull breakout is weak. For example, they do not want the month to close on its high. They want August to have a bear body, and they prefer August to be a strong bear reversal bar.
Target for the bulls
At the moment, the monthly chart is strongly bullish. The obvious target for the bulls is a measured move up based on the 300 point height of the 2 year trading range. That target is around 2400. Will it get there? They have about a 40% chance.
Because the trading range is late in the bull trend, it probably will be the Final Bull Flag before at least TBTL Ten Bars, Two Legs sideways to down. A 10 bar correction on the monthly chart is about a year. The minimum target for the bears after the failed bull breakout is a test to the bottom of the trading range, around 1800. Because there is no sign of a top, it is better to think about being long than planning for a reversal.
Weekly S&P500 Emini futures candlestick chart:
Moderate follow-through buying after breakout
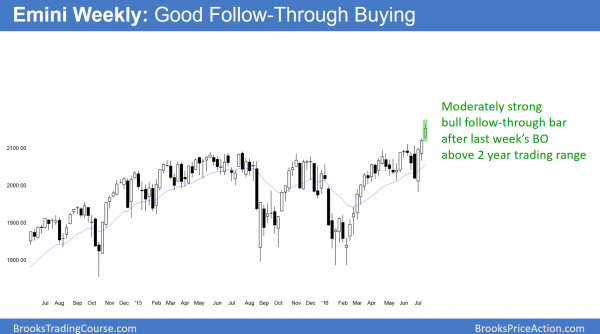
The weekly S&P500 Emini futures candlestick chart had a strong bull trend bar after last week’s breakout to a new all-time high. After 3 strong bull bars, bulls will probably buy the 1st reversal down. The bulls this week wanted a bigger bull body and a close on the high. Because the candlestick pattern was not as strong as it could have been, the risk of a pullback is greater.
The weekly S&P500 Emini futures candlestick chart formed a good bull follow-through bar after last week’s breakout to a new all-time high. After 3 consecutive strong bull trend bars, there is enough buying pressure so that traders will buy the 1st reversal down. Hence, any reversal down will probably lead to at least one more leg up.
Daily S&P500 Emini futures candlestick chart:
Outside down day, but bull micro channel
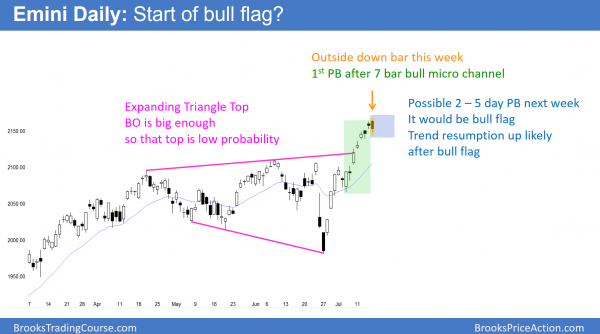
The daily S&P500 Emini futures candlestick chart formed an outside down day on Friday. As a result of the strong 7 day bull micro channel, the reversal attempt will probably become a bull flag.
The daily S&P500 Emini futures candlestick chart had a 7 bar bull micro channel and a strong breakout to a new all-time high. As bullish as this is, the stop for the bulls is now at least 100 points, or 5% below. An increasing number of institutions will conclude that this risk is unacceptable. Hence, they will need to reduce their risk. The easiest way is to reduce their position size.
2 – 5 day pullback soon
When a lot of institutions stop buying and instead begin to sell out of part of their long positions, the Emini will begin to pullback. However, the institutions have been so eager to buy that they have been buying above the prior day’s high all week. Most will be eager to buy below the prior day’s low. The odds are high that the bulls will buy the first reversal down.
However, because the Emini is so overbought on the daily chart, they will take quick profits if there is not an immediate strong bull trend resumption. The odds are that there will not be. This means that there will then probably be a 2nd pullback shortly after the 1st one.
Start of bull flag
Friday’s outside down day is a pullback, and it is probably the start of a small bull flag. As a result of the strong bull trend, the 1st bull flag will probably be small. Bulls will eagerly buy it. Many will wait for a High 2 buy setup, which is a micro double bottom. Because the bull trend is so strong, any reversal down over the next week will probably be minor.
The bears need either a huge bear trend bar or a series of small bear trend bars before traders will begin to believe that the breakout has failed. Even then, both of these reversals will probably need at least a micro double top before they begin. In conclusion, the downside risk is minimal next week, and the best the bears can reasonably hope to see is a pullback. However, that pullback will probably be a bull flag and not the start of a reversal down.
Traders can see the end of the day bar-by-bar price action report by signing up for free at BrooksPriceAction.com. I talk about the detailed Emini price action real-time throughout the day in the BrooksPriceAction.com trading room. We offer a 2 day free trial.
When I mention time, it is USA Pacific Standard Time (the Emini day session opens at 6:30 am PST, and closes at 1:15 pm PST). You can read background information on the intraday market reports on the Intraday Market Update page.


Hi Al,
Making an all time high “after” the Brexit vote was surprising. In fact if the markets were weak that should have been a final blow as it was a historic event.
Now Q/E is being thrown around, there have been a few calling for a market crash yet it keeps on moving higher. Some have sound logic as well, too much world debt, less countries buying US treasuries etc, but the FED keeps on changing the rules. So he who has the gold will control the game. Individual traders have absolutely no influence on anything. Perhaps there will be a crash then those doom callers will be right after all, I guess if you keep saying the same thing over and over you will be 1/2 right eventually.
A serious crash or reversal will show in the candles. The only thing I have taken notice of is that global tensions and large macro events are becoming more and more prevalent but once again all you need is price action. Watching a major trend line on a higher time frame is all that’s needed but of course the waiting might be the hardest part to this style of trade. In my view a reversal and bear market could begin when the bottom of the trading range is breached with weekly and monthly candles closing on their lows. it will be very interesting if your measured move 2400 is reached, wonder what the doomers would say then.
Al,
I noticed the Turkish coup made the markets (eminis…. NQ, YM.. etc)) drop after the close on Friday. What are your thoughts about a continuation of the drop? Maybe this event won’t influence the beginning of next week?
Thanks- Richard
Sometimes news can cause a brief move, but I have said for the past few days that the Emini will probably pull back for 2 – 5 days simply because the stops are too far below so traders have to reduce their position size. I did not know the Turkey coup would happen. Is that the reason for the pullback? Of course not. I have been talking about the pullback for days before the news.
This is like Brexit. I wrote at the time that it was irrelevant, and if the market was going to continue down, it would not be related to the Brexit vote. It would be purely technical due to a failed test of the top of a 2 year trading range. Brexit was much bigger news than Turkey. Yet, the bearish news was the start of a successful breakout. News is useless and will not help anyone make money.
I wasn’t planning on trading any news. It seemed like the after hours move was due to the news. Thanks for your insight.
Nice detailed explanation, thank you.
Al,
Thank you for the commentary. It is clear to me what the market is doing AFTER I read your remarks. Thank you.