Market Overview: FTSE 100 Futures
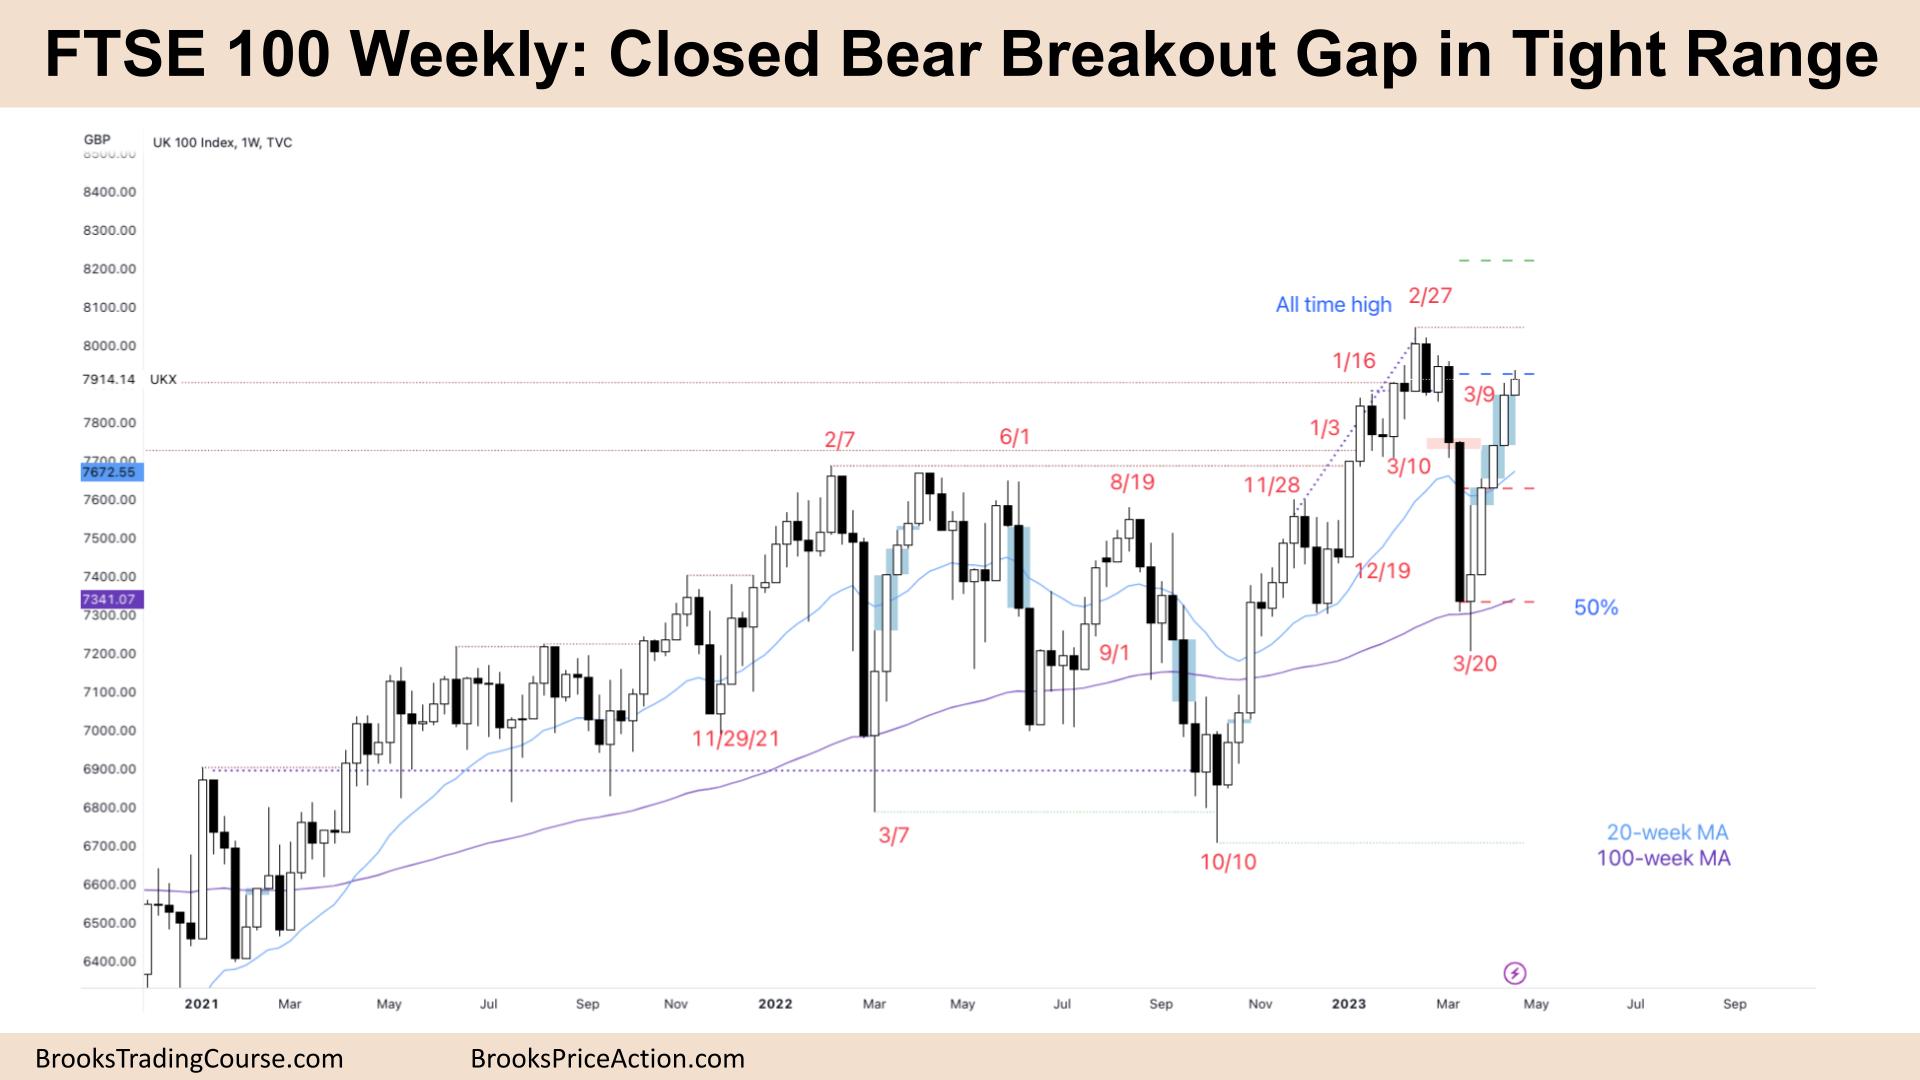
The FTSE futures market moved higher last week as bulls closed the bear breakout gap. Longer-term bulls bought the 200-week MA and are sitting on big profits. The bear spike down was strong enough, so likely sellers above and near the highs, so we might need to go sideways here. Expect sideways to up next week.
FTSE 100 Futures
The Weekly FTSE chart

- The FTSE 100 futures was a bull bar with a small tail on top and no tail below.
- Bull closed the bear breakout gap from March.
- It is a five-bar bull micro channel with two strong gaps over the past three to four weeks, so we’re always in long.
- It was a deep pullback for the bulls after a breakout from the two-year trading range. The pullback went below the moving average and has now got right back up and closed the gap of the breakout point, and we’re going sideways at the tight trading range from February.
- The bears see a sell climax, a possible spike and are looking for a channel.
- They see we’re pulling back to create the channel, but the pullback is very deep. It looks more like a trading range.
- For the bulls, it was disappointing that the pullback was so large, and the climax bar on March 13th allowed the bears from December 12th to get out breakeven.
- So bears sold at the top of the trading range, sold more higher and made money. Limit order bears are making money, which shows you that the bull trend is not as strong.
- The bulls want a pullback and then a second leg sideways to up. Because it’s a five-bar bull micro channel, the first-time price goes below a prior bar, it is a reasonable buy entry.
- For the bears, nothing to sell yet. On January 30th there was an outside up buy signal, and we’re back at the high of that buy signal, so we’re going sideways.
- Bulls are still on the swing buy above the doji at the moving average and were looking for a measured-move up.
- We are just below the measured move target, so more likely we will head up to 7970 and close the gap back up to 8000.
- The bears want a second entry sell signal, a low 2 and high in the trading range is a reasonable trade, but it might need to go above 8000.
- Some bears, after seeing two very strong bear bars and a sell climax, sold the moving average and are now trapped, so those bears will need to be let out.
- If we use a measured move from 8000, that would be 7781, where the bears need to get out of that trade break-even.
- In terms of context, it was a wedge top, three pushes up, November, January and February, and traders expected two legs sideways to down.
- Some saw the sell climax in March as the second leg, but bears see a strong first leg and then a deep pullback for a second leg that’s more symmetrical in the line.
- Some bears will be disappointed at the strength of this breakout and how strong the gaps are.
- If you take 50% from that doji to the breakout gap from last week, which is the top of the sell climax, around 7750, there are probably bears trapped there as well. So if we pull back, we’re probably going to the high of that bar, which was a reasonable place to sell high in the trading range.
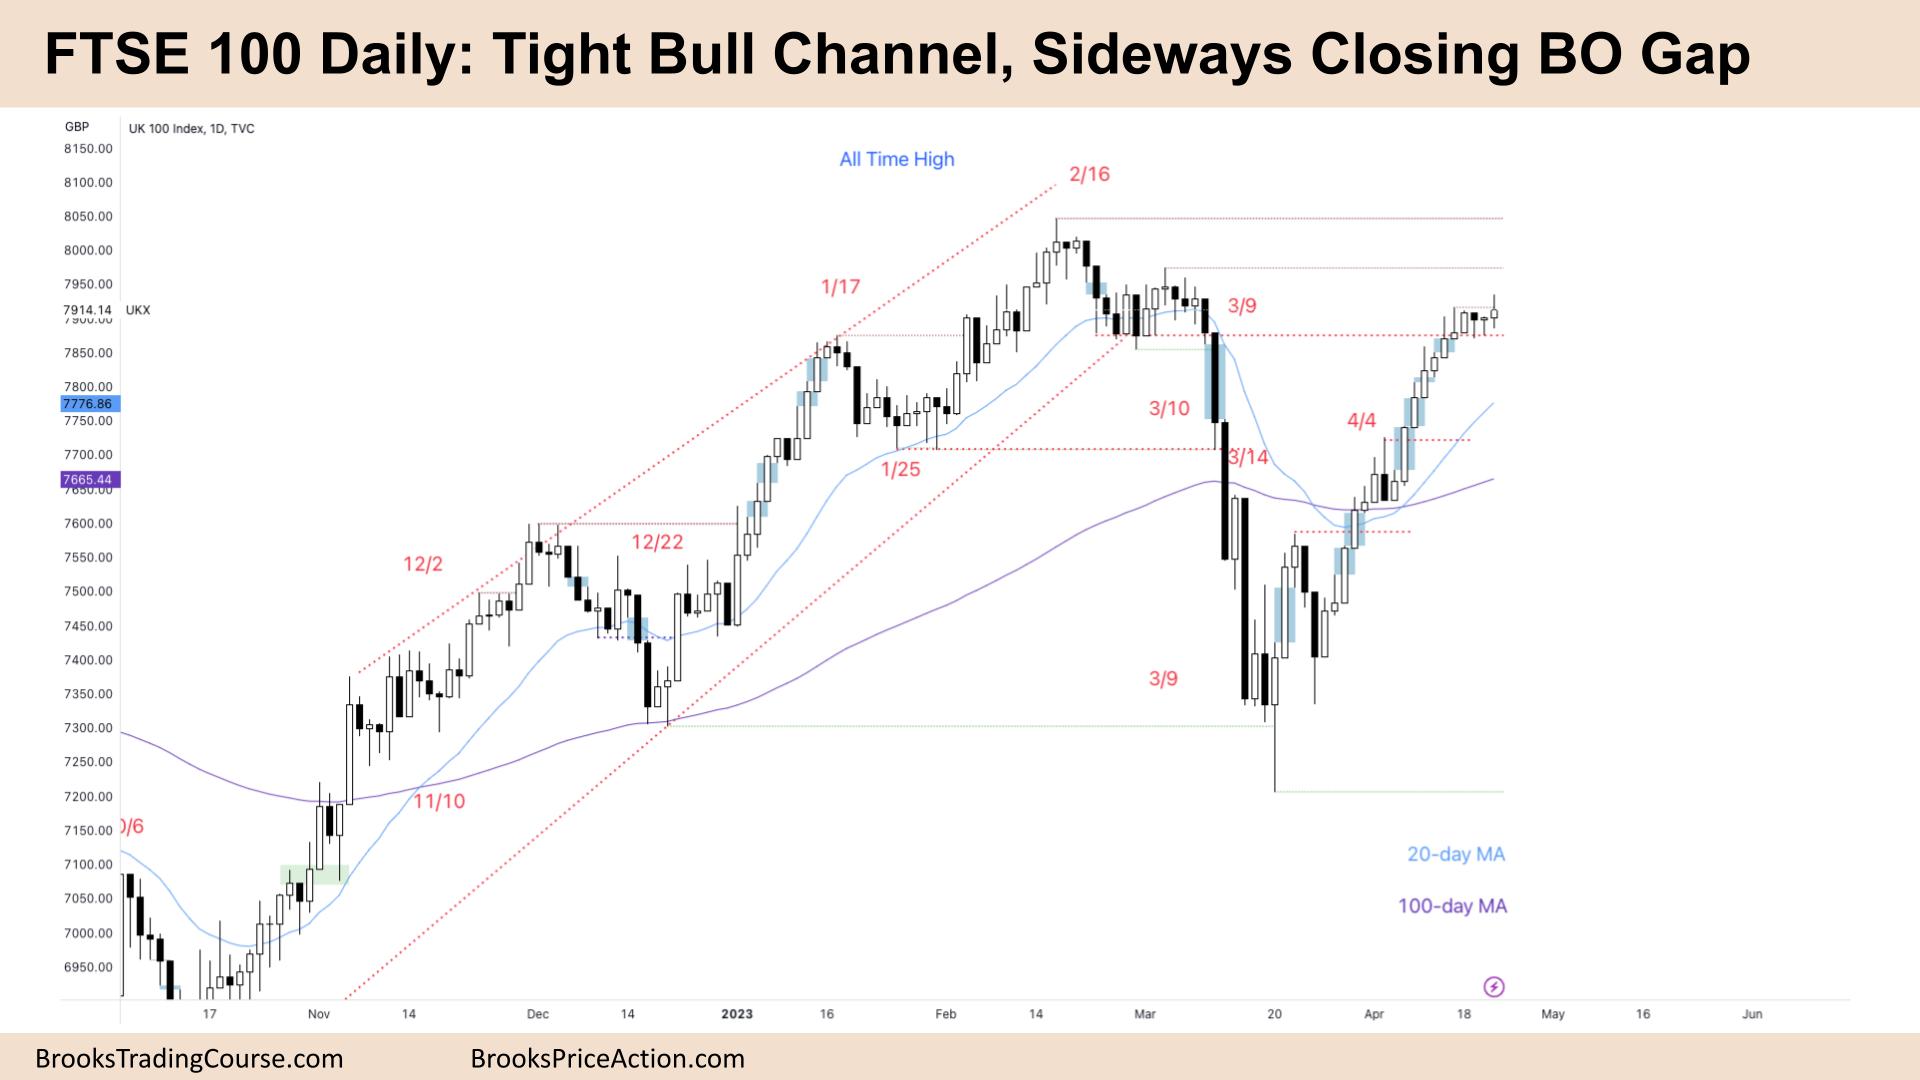
The Daily FTSE chart

- On Friday, the FTSE 100 futures was a small bull doji with a big tail above.
- Bulls closed the bear breakout gap on the weekly chart.
- We had two inside bars last week: sideways and a possible final flag.
- It has been in a tight bull channel, possibly a small pullback bull trend, but you can see the legs are getting weaker, but we’re always in long.
- For the bulls, it was a failed double top and then a measured move up from the parabolic wedge bottom in March.
- It looks like they’ve got three legs up, but tight bull channels are constantly creating wedge tops, and most traders should ignore sell signals. 80% of pullbacks end up being flags and good with-trend setups.
- With the two inside bars last week – Thursday and Tuesday – the price now sits at the high of the inside bar.
- Inside bars have a higher failure rate for breakouts, so we’re getting a tail.
- Monday was a bull bar with a big tail on top, but it closed right on its low, so it’s actually a bear bar. So some bears will see Wednesday as a second entry short.
- On a lower timeframe, that was two attempts to reverse the trend and now bulls are moving the price higher.
- If you look left, you can see the tight trading range in February. We broke below it, even though it was a high-probability buy setup that failed.
- Then we moved down in March with a parabolic wedge bottom and back up. That breakout gap has just been closed, and now we’re going sideways.
- For the bulls, it was a failed breakout below, and they want a measured move to 8,000 and higher.
- For the bears, it did a lot of damage to the prior bull trend, and now they’re looking at this as a possible final flag, maybe one brief leg up to near 8,000 before going sideways.
- But there are no bear bars. Wednesday was a weak sell signal, closing in the top half of the range.
- We are far above the moving average, so traders will expect any pullback to the moving average to be bought, which is reasonable because there are strong gaps in the last leg.
- There’s also a support area above the inside bar from April 13th, so traders should expect sideways to up her.
Market analysis reports archive
You can access all weekend reports on the Market Analysis page.

