Market Overview: FTSE 100 Futures
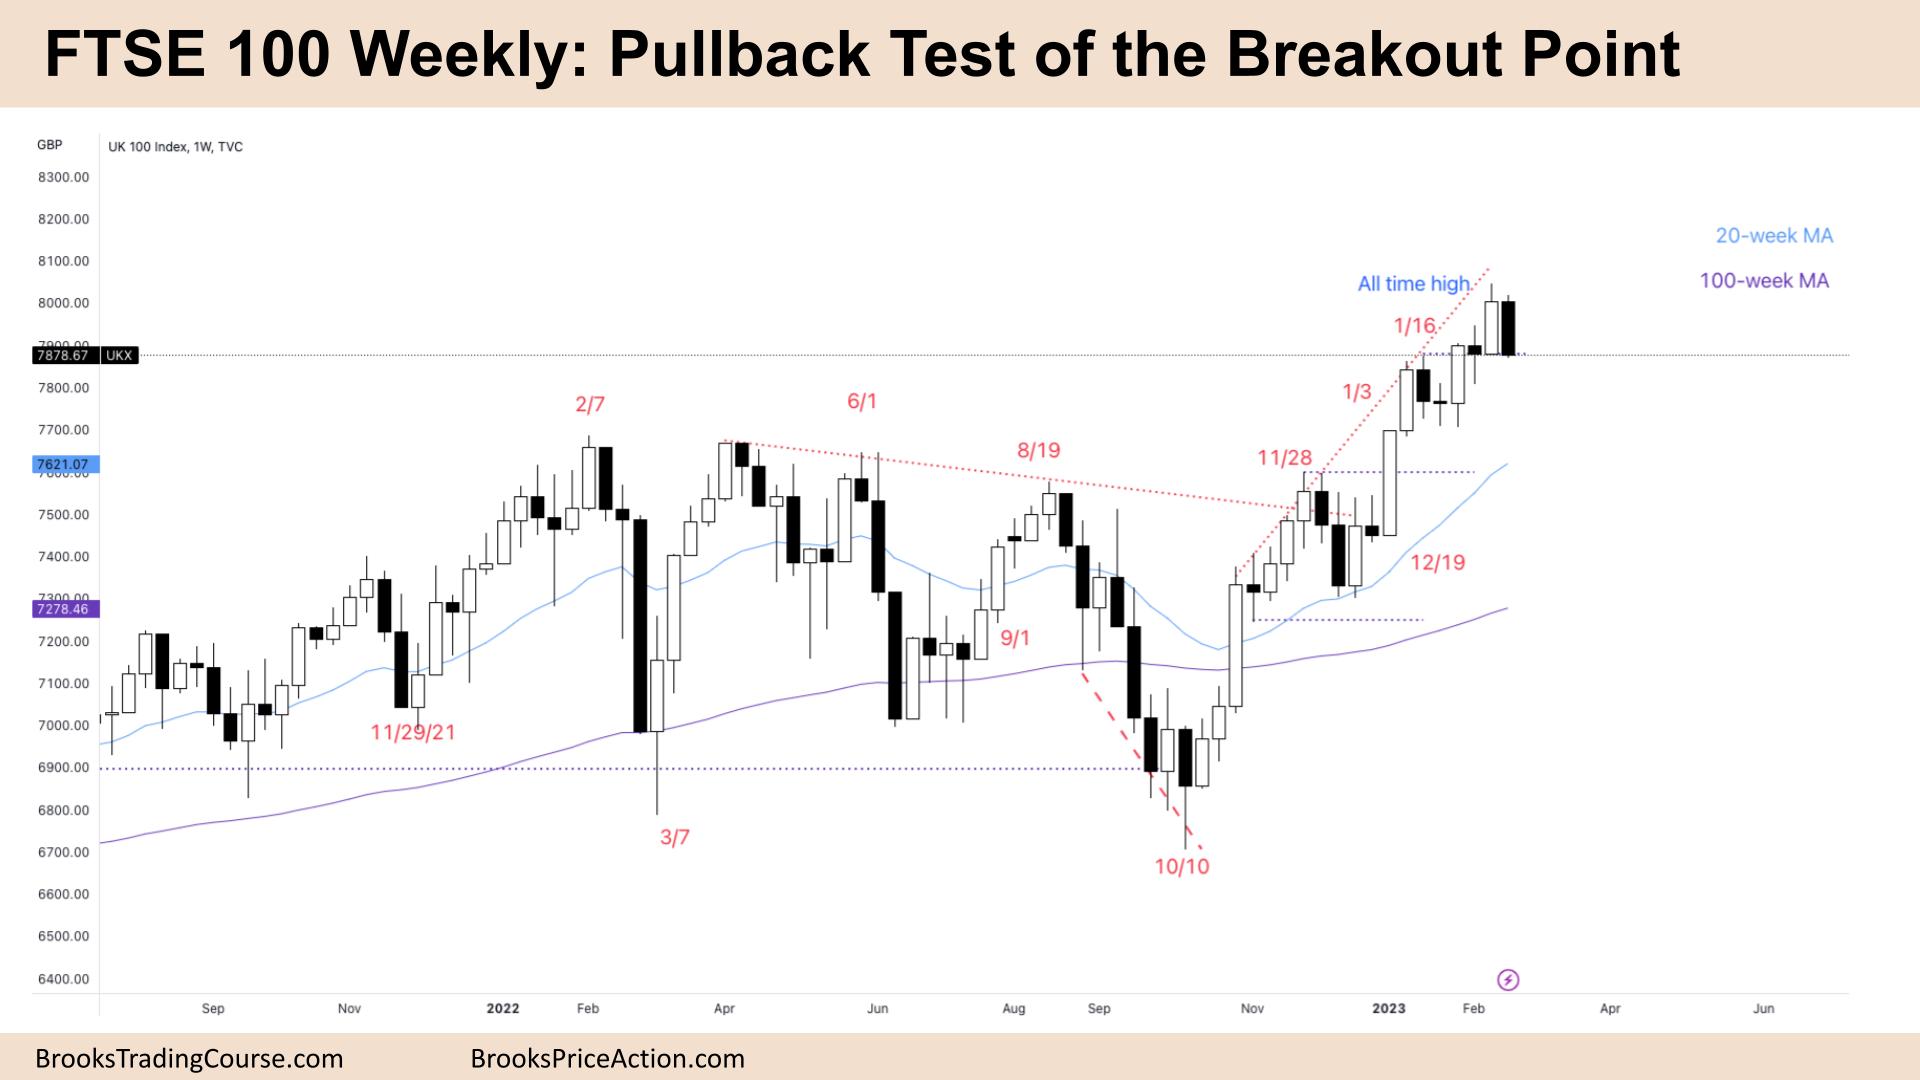
The FTSE futures market reversed last week with a big pullback test of the breakout point. It is a bear surprise, but sitting in a tight bull channel will likely form a bull flag. The bears want a follow-through bar to create a top for the next few months. The bulls know there are many gaps below, and it will be difficult for the bears to create a strong bear case yet. We have had about five weeks of sideways price action here, so expect sideways to down next week.
FTSE 100 Futures
The Weekly FTSE chart

- The FTSE 100 futures on the weekly was a big bear bar closing on its low.
- It’s a pullback test of the breakout point at the All-time high.
- The bulls see a tight bull channel. That means we are always in long, and most reversal shorts will fail and become bull flags.
- The bears see the move up but see three pushes and see a wedge top and possible reversal setup if we trade below last week.
- The bulls want a pause here and a bull flag.
- The trend is weakening, and the dojis in between bars mean that bulls are taking profits and buying below bars, not above.
- That means we are more likelier to form two legs sideways to down for a larger pullback, perhaps to the moving average.
- The bears want last week to be a failed breakout and get a follow-through bar this week – consecutive decent bear bars will suffice.
- The probability is long, but the bulls need a wide stop, which might create a sideways movement.
- Multiple open gaps are below, making it difficult for the bears to hold for a swing.
- The bears see this as a broad bull channel or wide trading range and are looking for second-entry shorts to sell – some may sell above this week, betting the breakout above will be small.
- Last week was a surprise, and that might convince traders to buy further below the bar and perhaps a scalp distance below.
- Expect sideways to down next week.
- The bulls ideally want to trade below last week and then close above it – an outside up bar. But this is probably only 40%.
- Most traders should be swing trading and expect reversals to fail and become some pullback test of a breakout point.
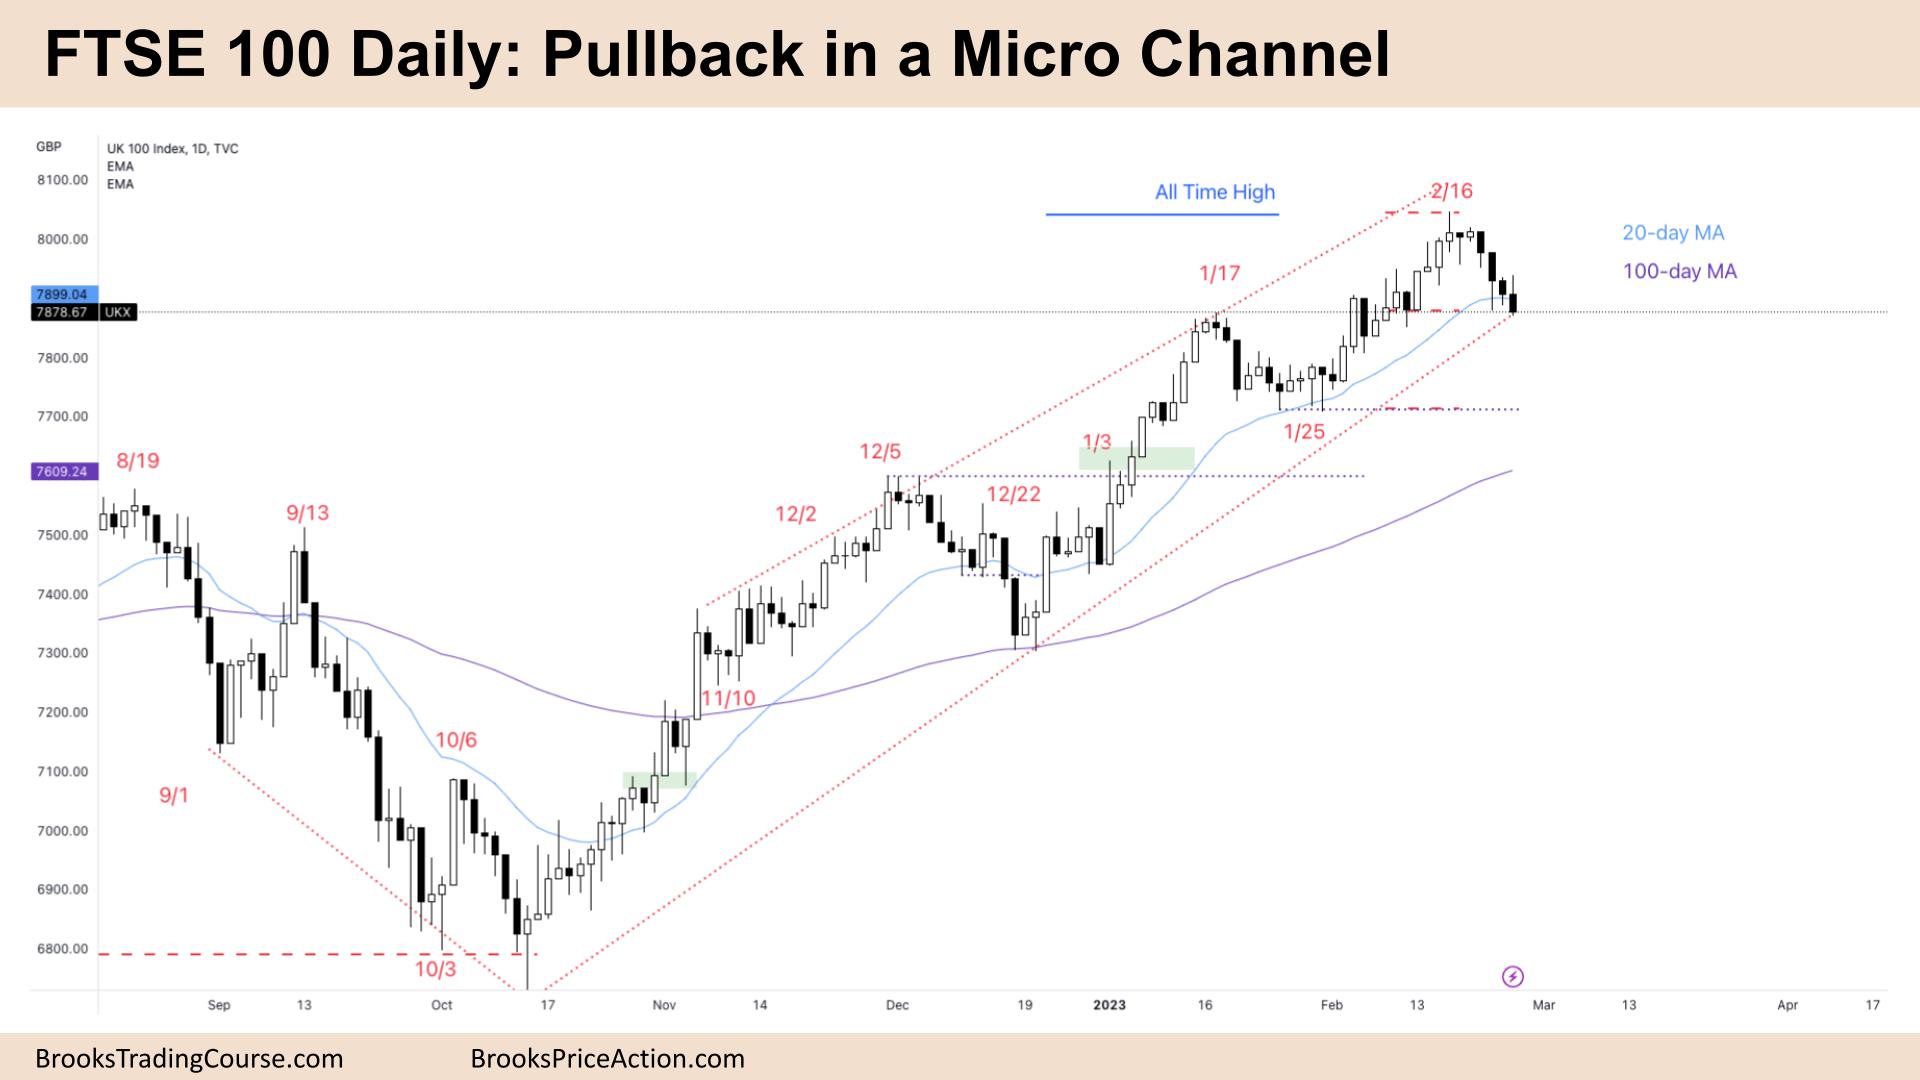
The Daily FTSE chart

- The FTSE 100 futures on Friday was a bear outside down bar, closing on its low.
- It is the fourth consecutive bear in a tight channel, closing below the moving average.
- It was a Low 2 sell below Monday’s small bull doji. It was a bad sell signal, so it became a magnet above.
- For the bulls, a tight bull channel is becoming broader. That means the pullbacks have two legs and might even become always in short.
- They see a breakout above a swing high and now a pullback test of the breakout point. No matter how bearish it looks, most reversals fail in trends and become flags.
- Limit bulls will look to scale in lower, betting the Jan 25th swing low will hold and form a trading range and not collapse.
- The bears see a surprise and expect a follow-through second leg.
- Limit order bears will start to scale in above this leg and the big bar on the weekly chart. That might become the top for the next few months.
- Both traders saw the last close below the moving average on the daily chart at least two months ago.
- Bulls will look to buy a 50% pullback of the last leg above a bull bar and may wait to buy around the swing low.
- The bears need a lower high to do real damage here. It is a tight channel so most traders expect a second leg, and it might form a wedge bottom.
Market analysis reports archive
You can access all weekend reports on the Market Analysis page.

