Market Overview: FTSE 100 Futures
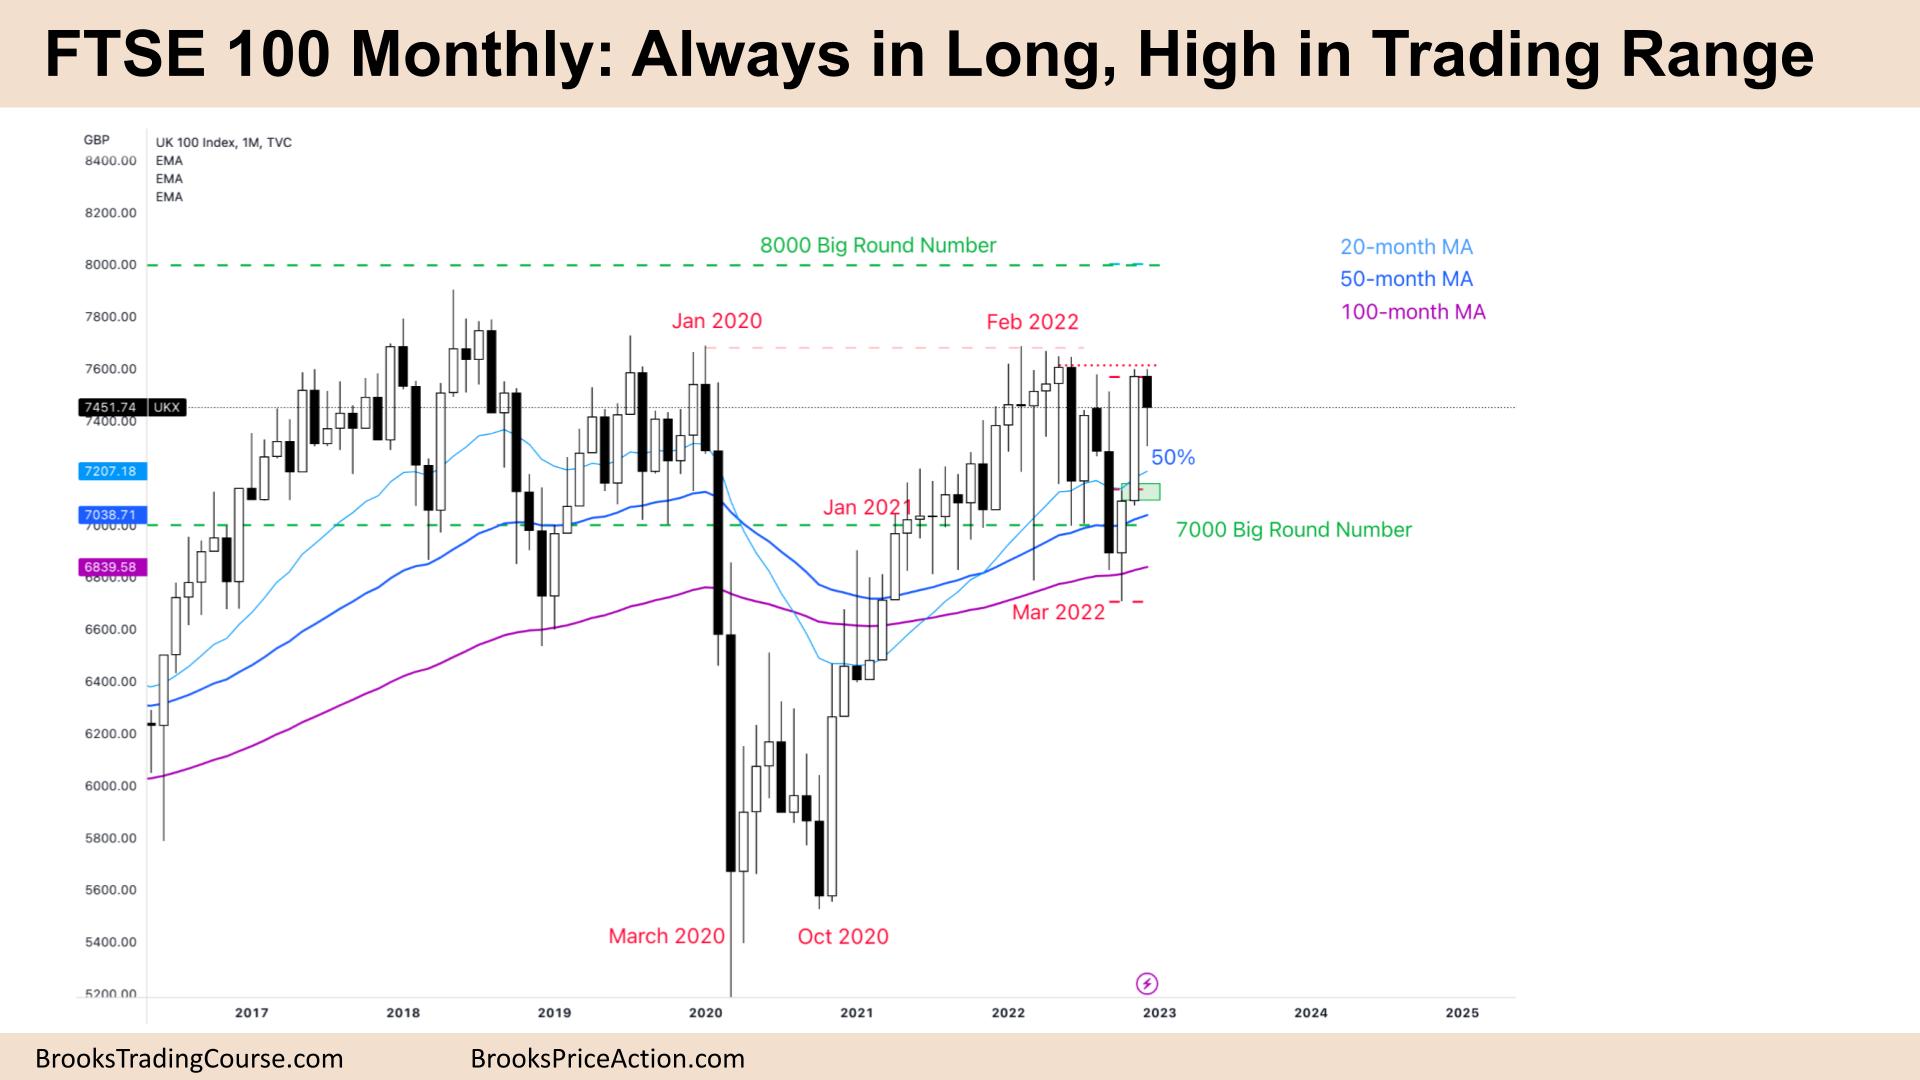
FTSE 100 always in long with a small bear inside bar high in a trading range. The bulls see a pullback and want a reasonable buy signal for a continuation higher, and they might get it. The bears wanted a second entry sell signal but the bar closed above it’s midpoint so they might be hesitant to sell here. More likely buyers below and sellers above so sideways to up next month.
FTSE 100 Futures
The Monthly FTSE chart

- The FTSE 100 futures last month was a bear inside-bar, closing above its midpoint with a tail below. We are still always in long.
- It’s not a good enough sell signal, so more likely buyers below are betting on continuation higher.
- But its a bear bar, so, not a great buy signal, either.
- We are still on the double bottom buy signal from 2 months ago, so last month was a pullback.
- The bulls see we are always in long, consecutive bull bars. They see a pullback and expect a second leg.
- They see a breakout and have not yet tested the breakout point, so it is still more bullish.
- But high in a trading range, it would be a higher probability to wait for a breakout or a two-legged pullback.
- The bears see a second entry short, but it’s a bad sell signal. They might consider selling above this bear bar, betting on a failed breakout of the trading range.
- The bulls want a second leg, and they might get it. The bears didn’t do enough to attract sellers yet. But they need a close above the prior range to the left.
- Bears see a failed breakout above the trading range and will sell new highs. Because 80% of breakouts fail, it is a reasonable strategy.
- If you had to be long or short, it’s better to be long. Bulls can exit below a bear bar. Too early to sell on close. But bears can look to sell above on a limit or momentum if the 2nd entry sell follows through.
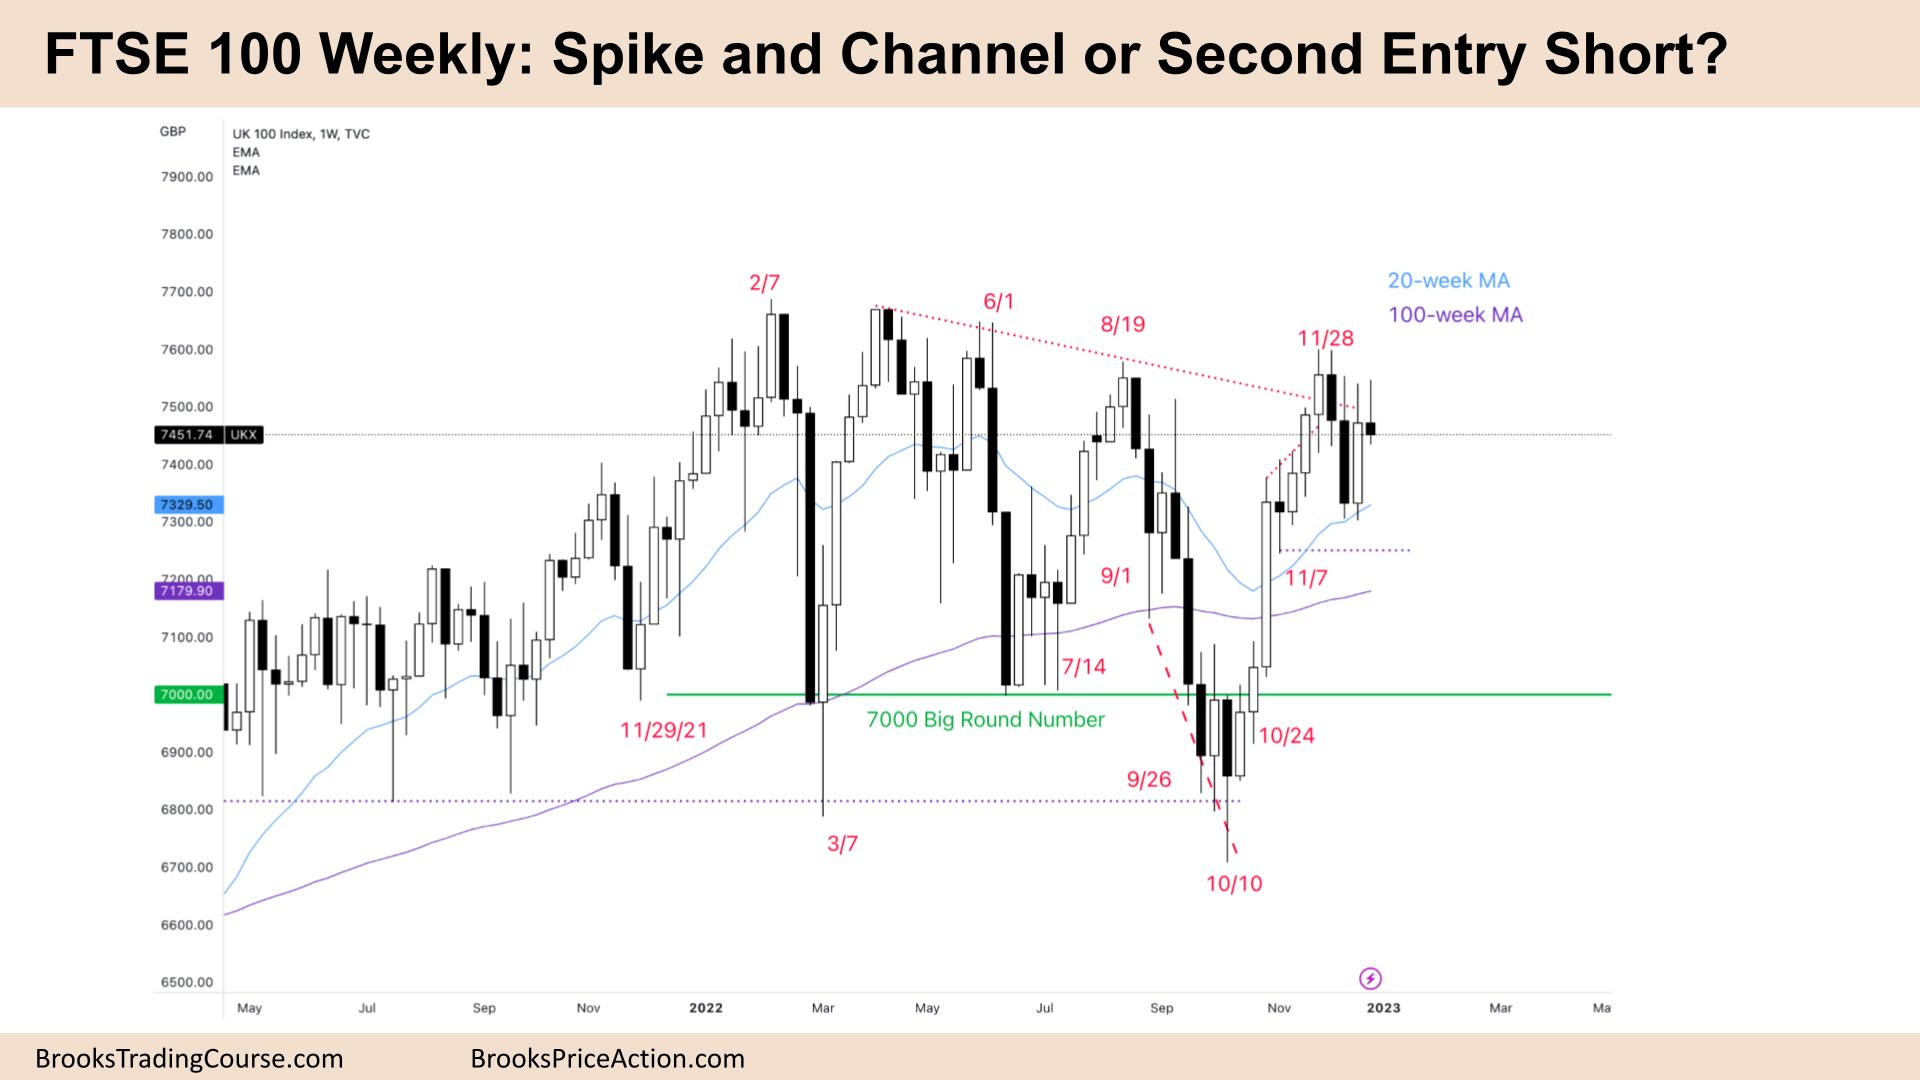
The Weekly FTSE chart

- The FTSE 100 futures last week was a bear doji with tails above and below.
- It closed below its midpoint, so it’s a bear bar. But it is not a strong sell signal.
- It looks like we have been going sideways for six weeks.
- We triggered a High 1 buy signal above last week, but only limit order bears were there, not buyers.
- The bulls might need a High 2 or consecutive bull bars to step in. We might form a wedge, High 3, before they feel confident again.
- The bulls see a spike and channel bull trend, a pullback to the moving average, but it lacked follow-through. They think we are forming a bull flag.
- The bears see a second entry short, a possible double top, or a micro double top high in a trading range.
- But the small tail below the bar suggests they are hesitant to sell. It’s a bad buy above this bar, so it might be a better place to sell.
- The bulls want a pullback to the moving average for a buy setup. They broke a prior high and want to continue higher. But it is the top of a trading range so that we might continue up in a channel.
- We were always in long until the pair of bear bars. Always in bulls will need consecutive bull bars to get in again.
- Ok, to sell for a scalp back to the moving average, but the probability is still on the long side.
Market analysis reports archive
You can access all weekend reports on the Market Analysis page.

