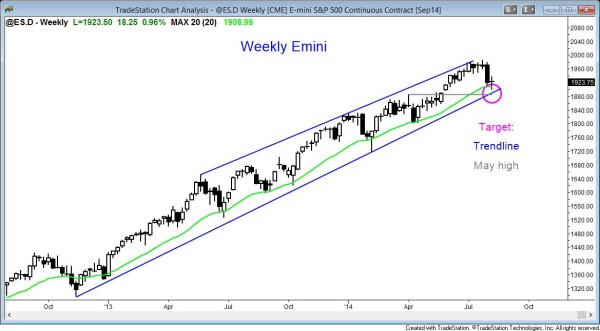
The weekly Emini candle chart is in a trend reversal down in a bull channel. It is finding support at the moving average and 1900, but the odds favor a move sideways to down to the bottom of the channel at a minimum.
The Emini this past week found support at the 20 week moving average and 1900. The low of the week did not quite reach the May 27 gap on the daily chart or the bottom of the weekly channel. The odds are 60% or better that the Emini and S&P500 will hit the bottom of the channel at a minimum after reversing down strongly from the top of the channel. It may or may not fill the gap on the daily chart.
This week’s Emini candle on the weekly chart was almost a perfect doji, which means that the bulls and bears were equally strong. Every tick matters, and the bulls were able to create a 1 tick tall bull body on the weekly candle. This is a statement by them that the bears were not strong enough to form a bear bar after last week’s strong bear trend reversal attempt.
The bears this week were looking for follow-through selling to confirm last week’s reversal. If they were able to create a lot of selling pressure (signs of selling strength), more traders would be willing to short at the market and as the market falls. They needed a big bear trend bar closing on its low and well below the moving average, and below last week’s close and low. They achieved little this week. All they were able to do is to stop the bulls from forming a strong bull reversal bar at the moving average.
The bulls wanted a strong bull reversal bar to reverse the strong bear breakout of the prior week. That wanted enough buying pressure so that traders would have concluded that the prior week was a failed bear breakout. Had the bulls succeeded in creating a strong bull reversal bar at the moving average, this week’s candle would have been a reliable buy signal bar going into next week. Bulls would have been willing to buy above this week’s high. Instead, the 1 tick bull body is not enough. There will probably be more sellers than buyers above this week’s high.
Part of the reason why there probably are more sellers above is the weak buy signal bar after a much stronger bear breakout. I mentioned other reasons last week. There was a 10 bar bull microchannel that had a bear breakout a few weeks ago. This is usually followed by a few bars up to a new high, which the market accomplished. Then, there is usually a bigger correction that has at least two legs and lasts about 10 bars. This week might have ended the first leg sideways to down. There are many bulls who bought at higher prices in July and they want to lighten up or exit after last week’s strong bear breakout. They will use any small rally to sell out of their longs. Bears will use that same rally to initiate shorts, expecting at least a second leg down.
The bear breakout below the microchannel followed by the test up and then the reversal down, and the reversal down from the top of the channel both usually lead to corrections that last more than a few bars. The odds therefore favor at least 10 bars and two legs sideways to down. This means that the correction probably has more to go. For this premise to be wrong, the bulls need a big bull trend bar this week or the week after, and probably a move up that closes the July 31 gap down on the daily chart. This is possible, but the odds favor the bears until the bulls either reverse the Emini up strongly, or create a better bottom.
Traders can see the end of the day bar-by-bar price action report by signing up for free at BrooksPriceAction.com. I talk about the detailed Emini price action real-time throughout the day in the BrooksPriceAction.com trading room, and a 2 day free trial is available.
When I mention time, it is USA Pacific Standard Time (the Emini day session opens at 6:30 am PST, and closes at 1:15 pm PST). You can read background information on the intraday market reports on the Intraday Market Update page.

