Market Overview: Weekend Market Analysis
The SP500 Emini futures had a failed breakout above the top of its 4-week trading range last week, and a failed breakout below this week. Consecutive outside bars on the weekly Globex chart. The strong reversal up this week makes a successful breakout above the range more likely than a breakout below. The bulls would then look for a 200-point measured move up to 4,400.
The EURUSD Forex market reversed down this week after last week’s reversal up. It has stalled for 4 weeks at the top of its 10-month trading range, and it will probably not break out of the range for at least a couple more months.
EURUSD Forex market
The EURUSD weekly chart
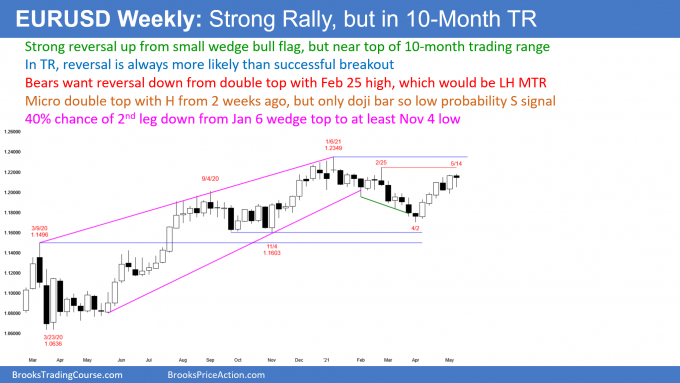
- Last week was a big bull bar that traded below the low of the prior week, and closed above its high. It was therefore an outside up week.
- This week traded above last week’s high and reversed down. It closed with a small bear body.
- This week is a micro double top with the bear bar from 2 weeks ago.
- The micro double top, the small bear body, the location (back in the December to February trading range), and the reversals in each of the past 3 weeks increase the chance of next week being a 5th sideways week.
- The 7-week bull channel is tight, so a reversal down will probably only last a week or two.
- Near the top of the 10-month trading range that began in August. Since most attempts to break out of a trading range fail, the current 2-month rally will probably continue to stall here.
- There is room to the top of the 10-month range, and the 7-week rally has been strong. The EURUSD might work a little higher over the next month, but the current leg up will probably not break above the January 6 top of the range.
- Traders will continue to look for reversals every 1- to 3-weeks.
S&P500 Emini futures
The Monthly Emini chart
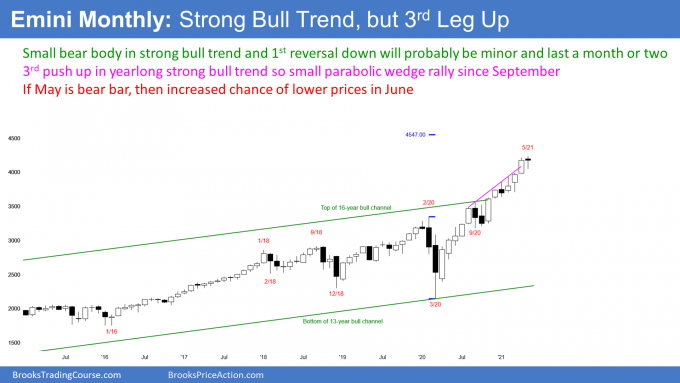
- Strong bull trend for more than a year. If May is another bull bar, traders will continue to look for higher prices.
- Small bear body so far in May. The bear body is the 3rd reversal down in the tight bull channel from the March 2020 low. If this month is a bear bar at the end of the month, there would then be a parabolic wedge top, which is a type of buy climax.
- Buy climaxes often attract profit takers. A big bear body in May would increase the chance of a pullback in June.
- A tight bull channel is a strong bull trend, and a sign that the bulls are eager to buy.
- The parabolic wedge top only has a 30% chance of immediately reversing into a bear trend, without first transitioning into a trading range.
- Bulls therefore should buy the 1st 2- to 3-month selloff. That limits the downside risk over the next several months.
The Weekly S&P500 Emini futures chart
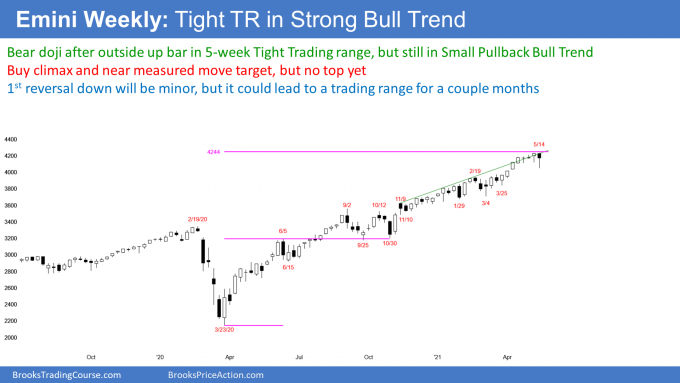
- This week was a big bar, and it broke below last week’s low and the bottom of the 4-week tight trading range.
- It closed far above last week’s low, and it is therefore not a good candidate for the start of a correction.
- However, because it had a small bear body, it is a weak High 1 pullback buy signal bar for next week. There might be more sellers than buyers above its high.
- Small Pullback Bull Trends, like the past year, rarely last more than 60 bars before transitioning into a trading range. There is currently a 60% chance that the weekly chart will evolve into a trading range this summer.
- The conversion requires a reversal. When a buy climax reverses, the correction usually lasts longer and falls deeper than any earlier correction in the trend.
- The biggest correction during this rally was the 10% selloff in September and October.
- Therefore, once a correction begins, the selloff should be more than 10%, and last more than a couple months.
- Institutions say that a 10% selloff is a correction, and a 20% selloff is a bear market.
- There is a 40% chance that once there is a correction, it will continue down to 20%.
- It is important to note that there is no top yet. Traders continue to buy, expecting at least slightly higher prices.
Weekly Globex chart has OO setup
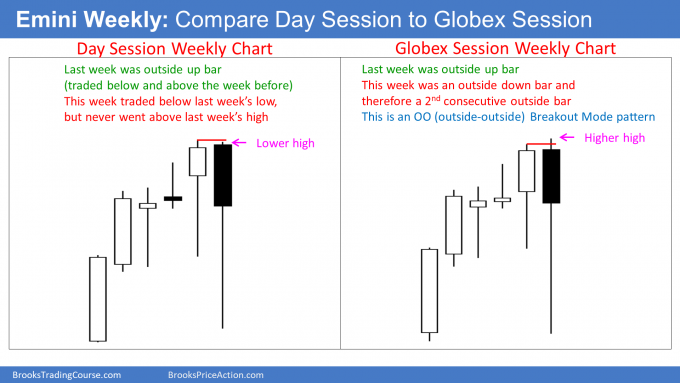
- On the weekly Globex chart (chart on right) this week’s high was above last week’s high, and this week’s low was below last week’s low. It therefore is an outside bar.
- The week before was an outside up bar.
- Consecutive outside bars is an OO pattern (outside-outside). It is a Breakout Mode pattern.
- Traders will theoretically look to sell below this week’s low, and buy above this week’s high. This is true even if the breakout comes several weeks from now.
- Many traders will not actually sell below or buy above, because the bar is big, and therefore the risk is big.
- However, once either signal triggers, traders will tend to look for trades in that direction on the daily and 60-minute charts.
- If one signal triggers but the Emini then reverses and triggers the opposite signal, some traders will reverse.
- The day session weekly chart (on the left) is almost an OO pattern. The more a market does something that resembles a pattern, the more it will behave as if the pattern actually formed.
- I am showing the weekly Globex chart to illustrate the OO pattern. Traders can see that the day session’s weekly chart is very similar.
- Therefore, traders will be bearish if there is a breakout below this week’s low.
- Also, they will be bullish if there is a breakout above this week’s high on the weekly Globex chart, or the high of 2 weeks ago on the weekly chart of the day (which is slightly above this week’s high).
- Finally, a breakout of a Breakout Mode Pattern has about a 50% chance of failing and then reversing. Therefore, traders will watch for a possible reversal trade after the breakout.
The Daily S&P500 Emini futures chart
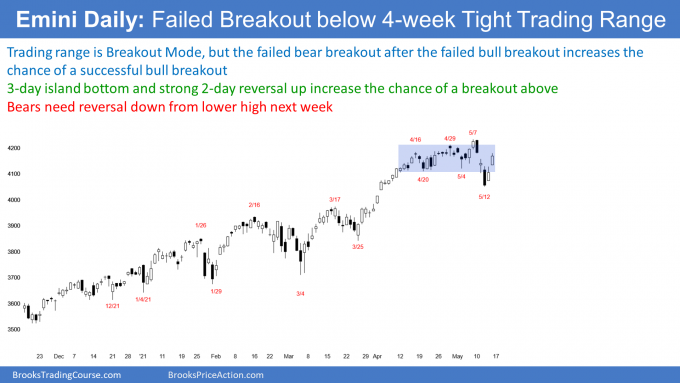
- Last Friday broke above the 4-week trading range, but the breakout failed.
- This week broke below the bottom of the range, and the bear breakout failed as well.
- A failed bear breakout after a failed bull breakout increases the chance a successful bull breakout.
- Remember the OO on the weekly chart. It is simply a reflection of the repeated reversals on the daily chart.
- If the daily chart breaks above the trading range, which is now more likely than not, the breakout would trigger an OO buy signal on the weekly chart.
- Traders would then look for a 200-point measured move up to above 4,400 instead of a 200-point measured move down.
- Even though the daily and weekly charts are in Breakout Mode, which is approximately a 50-50 market, this week’s strong reversal up from a failed bear breakout makes a bull breakout more likely.
Trading Room
Traders can see the end of the day bar-by-bar price action report by signing up for free at BrooksPriceAction.com. I talk about the detailed Emini price action real-time throughout the day in the BrooksPriceAction.com trading room. We offer a 2 day free trial.
Charts use Pacific Time
When I mention time, it is USA Pacific Time (the Emini day session opens at 6:30 am PT, and closes at 1:15 pm PT). You can read background information on the intraday market reports on the Market Update page.


Does the Doji on the 11th make the move down from the 7th two legs?
A doji or a bull bar is a pause in a selloff, and what follows is always a 2nd leg. However, as that 2nd leg is happening, traders don’t yet know if the 2nd leg is the 2nd leg down from the high or a 2nd leg within a bigger 1st leg down. They only know after the reversal up.
The bears still have a 40% chance of a 2nd leg down from a lower high. But, the reversal up was strong and the context (a failed bear breakout after a failed bull breakout) is good for the bulls. As I wrote above, it is currently more likely that the rally will break to a new high.
Thanks for the detailed report Al. Re MM anticipation: on the monthly the mid point is based upon feb-2020 high while on the weekly its based upon june-2020 high that have been retested from top by sep-2020 & oct-2020 while for both time frame bottom is identical. based on that weekly have no room to grow. Wondering why you don’t use same price level for the mid point?
Both measured move setups are visible on both charts, but one setup is clearer on the weekly and the other is more obvious on the monthly.
I am paying attention to both, but I think the weekly chart is more striking. A double bottom bull flag test of a breakout point and then a strong rally is sign that a lot of computers are paying attention to it.
On the monthly chart, the February 2020 high is clearly important.
The weekly chart has been stalled for 5 weeks at the weekly target. With this week’s reversal up on the daily chart, the odds are that the bulls will get the weekly target. They will ten focus on the monthly target.