Monthly S&P500 Emini futures candlestick chart: Triggered the sell signal, but needs strong entry bar
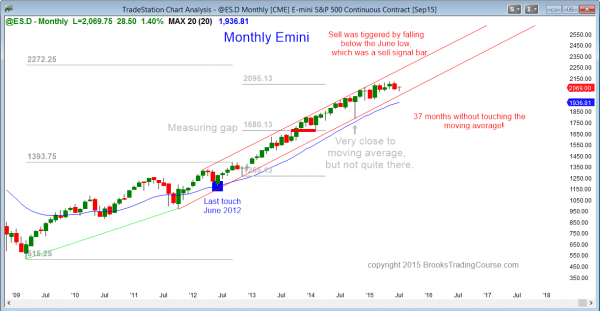
The monthly S&P500 Emini futures candlestick chart triggered a sell signal by falling below last month’s low, but the bears need a strong entry bar. There is still a long time before this month’s candlestick closes, and it could even be a buy signal when it does.
The monthly S&P500 Emini futures candlestick chart is still in a strong bull trend, but it is extremely overbought. The Crash in 1987 occurred following 38 months above the monthly moving average. July is now the 37th month above the average. While I believe that it will not crash, I think that there is an 80% chance that it will pull back to below the average at some point this year, and the average is about 10% down from the high. Since the Emini is so extremely overbought, there is about a 50% chance that the pullback will test the October low, which would create about a 20% correction. The bears need a strong bear breakout, which has not yet happened.
While it might come next week because of news from Greece, it is equally likely that it will rally on the news. However, any new high will probably fail to get very far until after there is a pullback to the moving average.
Weekly S&P500 Emini futures candlestick chart: Tight Trading Range
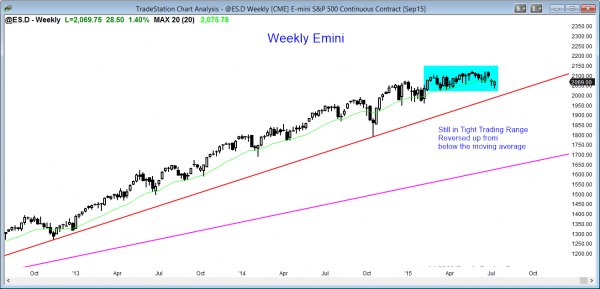
The weekly S&P500 Emini futures candlestick chart is still in its tight trading range. Although last week and this week both closed near their highs, this is the first time in 9 months when there have been consecutive closes below the moving average.
The weekly S&P500 Emini futures candlestick pattern is a 7 month tight trading range. Until there is a breakout, there is no breakout. If there is a bull breakout, it will probably be limited to about 5 bars (weeks) or less because of how overbought the monthly chart is.
Daily S&P500 Emini futures candlestick chart: Emini and Stock market trading at support
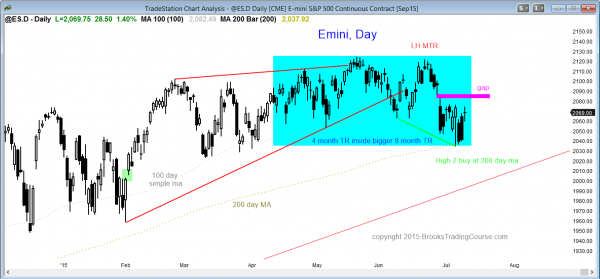
The daily S&P500 Emini futures candlestick chart is still below its gap down, but it is finding support at the 200 day moving average. It is in breakout mode.
The daily S&P500 Emini futures candlestick chart is in the early stages of a bear trend. When the Emini is in a trading range that lasts a long time, like this one has, it is also in a bull trend and in a bear trend. If the Emini rallies to a new high, traders will say that this trading range formed to relieve the overbought condition, but that the trading range was just part of the bull trend. They will point to the reversal up at the 200 day moving average as a sign of strong bulls buying at long-term support.
If the Emini has a bear breakout and enters a clear bear trend, traders will say that the bear began at the market top, which was almost 2 months ago. They will describe the trading since then as the early stages of the bear trend.
As long as the Emini remains below the gap down, the bears probably have a slightly higher probability than the bulls. If the Emini gets back above the gap, the odds will favor at least one more new high. Until there is a strong breakout with follow-through, the trading range will continue. Because the monthly chart is so overbought, a downside breakout will probably come this year, even if there is a bull breakout to a new all-time high first. Price action traders will continue to buy low and sell high until the breakout comes.
Traders can see the end of the day bar-by-bar price action report by signing up for free at BrooksPriceAction.com. I talk about the detailed Emini price action real-time throughout the day in the BrooksPriceAction.com trading room, and a 2 day free trial is available.
When I mention time, it is USA Pacific Standard Time (the Emini day session opens at 6:30 am PST, and closes at 1:15 pm PST). You can read background information on the intraday market reports on the Intraday Market Update page.


I believe the recent increase in volatility substantiates Al perspective. It seems a bull market needs conviction (and too for a bear market). We don’t have conviction in this market. The pro’s, when asked for feedback for the retailers, seem to be hedging a bit too much…they seem to be a bit fearful…for the most part. My conclusion: this market is excellent for short term swing traders and day traders.
Hi Al,
Sometimes I trade countertrend and finish in profits and sometimes I trade on trend and finish in losses. It depends on some tuning of my mind. My question is how do you prepare to your trading day.
Thank you in advance!
I think the most important thing before the market opens is to fight the tendency to have an opinion. I always assume that it can do anything, even if one thing looks likely. If anything, if something seems clear, always be ready for the exact opposite because the mkt will then probably have too many institutions trying to do that same obvious thing, and not enough doing the other.
For example, if yesterday was a strong bear trend, it seems logical to expect follow-through on the next day. When the day opens, it rallies. Why? because everyone to sell, but because they think yesterday might be a little climactic, they only want to sell just a little higher. As it goes up, the channel is too tight, so they wait some more. If they were still short from yesterday, they start to lighten up, lifting the market more. Eventually, there is a bull breakout with follow-through, and then a measured move up.
Al,
thank you and then another question.. It looks like there is no need to make analysis on say daily, weekly charts because they create some sentiment that can be opposite to that is going on on M5 charts. Is it right or not? And another question. I heard from psychologist Dr. Van Tharp that to have a big picture is a strength. But if I trade on M5 maybe I do not need this big picture. How do you think? How do you keep your opinions on say Eurusd on M5, M15, H1 , daily charts in your mind? Do you have some table for your sentiments?
Hi Al,
We have a gap to fill on the way to making new highs. Most won’t think this to be possible because most are short now thinking this is the bear trend started. But it’s the market’s job to strip you of your account is it not ? So the likely thing to happen is not only do we fill the gap but we make it into new highs (just). On the way shorts will get squeezed and a retest will have formed. As I understand it the professionals never take the first break.Greek news has already been discounted by the futures market, but when a catalyst arises that catches the market off guard then we will have the follow through into a correction. You would have to agree then for the market has done it’s job, stripping shorts and stripping longs. This is purely lateral thinking but when it plays out not exact but in similar fashion it makes more sense to me to enter a trade. Thanks for posting your analysis.
I think the logic is good. My concern is that the bulls are running out of time on the monthly chart. When the trading range is this tight, the breakout has to be a 50-50 bet up or down.
Watch the poison scene in the Princess Bride movie. We all can be outsmarting one another. You, I, and all the institutions know what you are saying, and that, too, has been discounted, and it is part of the 50-50 probability.
I am neutral over the next month or two, but bearish over the next 6 months. I don’t know if we go up first, but I am confident that we will go down, and however we do, it will be difficult to trade because it will be in a way that no one thinks is reasonable. There will have to be something about it that makes traders wonder if the move is real. Yes, there will be a big bear breakout, but it might last just a few days, and bulls will start buying, bears will take profits, and confusion will quickly return.
I think that is the real trap, and not the 50% chance of one more new high. We’ll see. It’s fun to watch.
I see the logic and humour in your reply. Perhaps the big players have already started averaging in. This would then cover both scenarios.
As you say the odds are in favour of a down move over the next 6 months.