The monthly S&P500 Emini candle closes on Tuesday
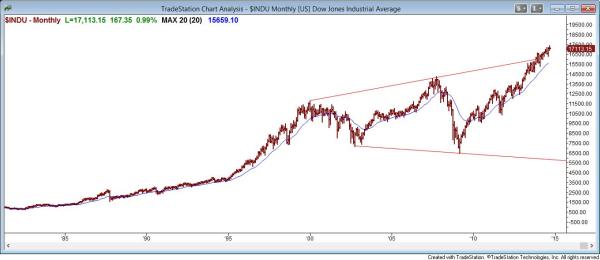
The monthly Dow Jones Industrial Average is at the top of an expanding triangle. However, most tops fail and become bull flags. The bull channel is so tight that bears would need many months to generate enough selling pressure to create a persuasive top.
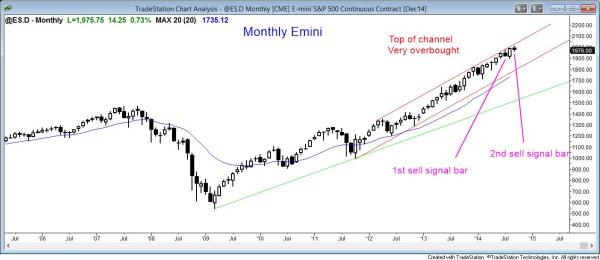
The monthly Emini chart is forming a second entry sell signal, but the bull trend is very strong. This makes the downside limited for at least several months.
The monthly Emini has been this overbought only three times in the past 20 years, and each of those prior times was followed by a reversal of at least 20%. There is no top yet, and it can become much more overbought before it corrects, but traders will be quick to exit longs and get short on a reversal. This could lead to a fast bear breakout.
The weekly S&P500 Emini candle chart triggered a weak weekly trend reversal
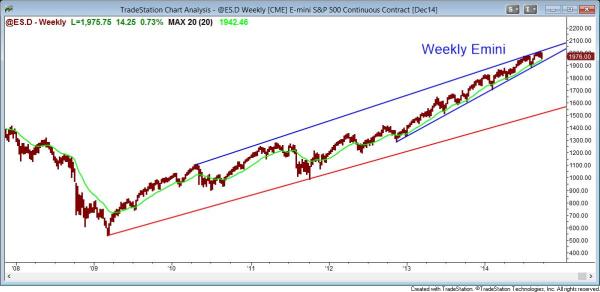
The weekly Emini chart is at the top of a channel.
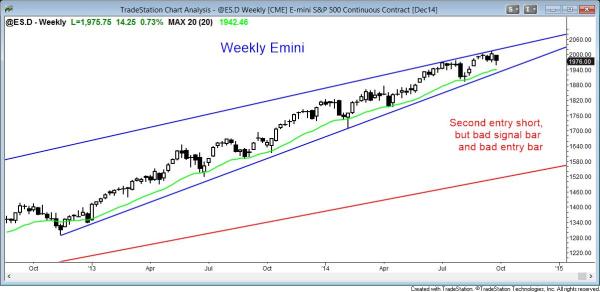
When this week fell below last week’s low, it triggered a second sell signal for a failed breakout above the July high. However, the signal bar (last week) had a bull body and the entry bar (this week) has a big tail and it closed back above last week’s low.
The daily S&P500 Emini candle chart had a bear breakout, but bad follow-through
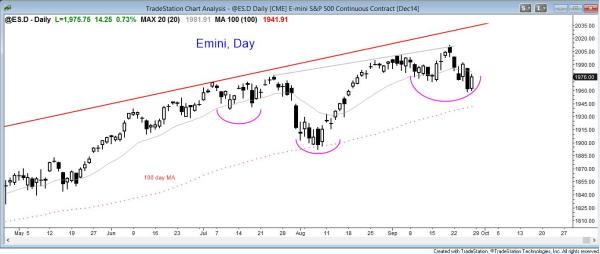
The daily Emini chart is deciding between a wedge top and a head and shoulders bull flag.
That bull flag is also a pullback from the breakout above July’s high. If the Emini rallies for a few day’s and the rally then turns down, that would create a month long head and shoulders top, which is a lower high major trend reversal. The bulls need a breakout to a new all-time high. Since the monthly chart is so overbought, a bull breakout probably would fail and lead to a move down to at least 1900.
The price action this week has been dominated by strong trend bars that reversed on the next day. This disappoints bulls and bears. When traders are disappointed by the follow-through after a breakout, the market is usually in a trading range. This means that this week’s sell off is probably a bear leg in a trading range rather than in a bear trend.
Trading ranges often break out to new highs and new lows, but then reverse and disappoint traders who hoped for a new trend. This week was a reversal down from a bull breakout. The Emini then broke below the bottom of the month long trading range and reversed up on Friday. However, that trading range might be just a part of a larger range with the August low as the bottom (around the 1900). At the moment, this is what I think is the most likely outcome over the next couple of months, especially since the monthly chart is so overbought.
Traders can see the end of the day bar-by-bar price action report by signing up for free at BrooksPriceAction.com. I talk about the detailed Emini price action real-time throughout the day in the BrooksPriceAction.com trading room, and a 2 day free trial is available.
When I mention time, it is USA Pacific Standard Time (the Emini day session opens at 6:30 am PST, and closes at 1:15 pm PST). You can read background information on the intraday market reports on the Intraday Market Update page.

