Monthly S&P500 Emini futures candlestick chart: Overbought and in breakout mode
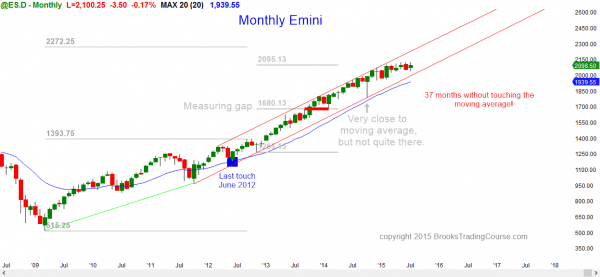
The monthly S&P500 Emini futures candlestick chart remains in its 7 month trading range and in breakout mode.
The monthly S&P500 Emini futures candlestick chart next week will be in its 38th consecutive month without touching the moving average. The S&P cash index has only gone longer one time in 50 years, and that began with the incredible rally that after the 1994 election when republicans took over the House. The rally continued for 44 months and then corrected 22%.
In 1987, the stock market crash began after 38 months above the monthly moving average. While a crash is not likely now, 1987 was another example of a 20% or more drop after staying above the moving average for a very long time. If the Emini does not touch its monthly moving average this year, that would be 42 months and almost as long as the 1998 rally. That rally was at the start of a trend and therefore was more likely to last a long time. The Emini now is late in a rally, which reduces the probability of the trend being the most overbought in over 50 years.
The odds remain about 80% that there will be a touch of the moving average this year, which would require at least a 10% correction. Because the Emini is so historically overbought, the correction might be deeper, and there is probably a 50% chance that it will fall below the October low. This would be a 20% correction.
There is no sign of a top yet, and there is a 50% chance that there will be a bull breakout first. It could rally for a measured move up, which would be about 80 points above the current all-time high. If the bulls do get their breakout, the 7 month trading range will then probably become the final bull flag before the reversal down to the monthly moving average.
Weekly S&P500 Emini futures candlestick chart: Price action pattern is still a tight trading range
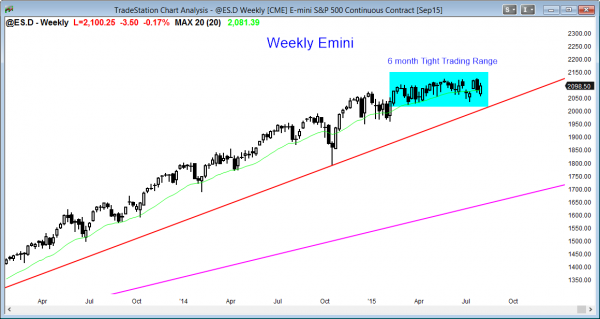
The weekly S&P500 Emini futures candlestick chart has been in a very tight trading range for 7 months with no indication of the direction of the eventual breakout.
The weekly S&P500 Emini futures candlestick chart is in a very tight trading range with no sign of an impending breakout. The breakout up or down will probably go for a measured move. A bull breakout will probably last 5 weeks or less, and then reverse down. Failed breakouts usually fail within about 5 bars.
Daily S&P500 Emini futures candlestick chart: Price action trading strategy before a breakout
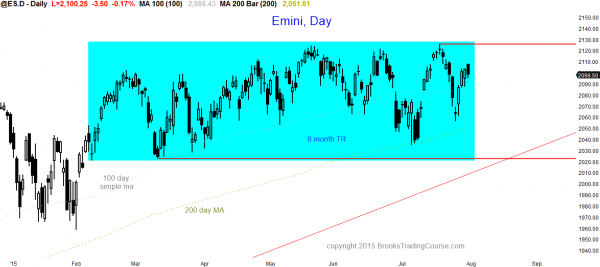
The daily S&P500 Emini futures candlestick chart has had several unusually big swings up and down over the past several weeks, which often happens before a breakout, but there is no breakout yet.
The daily S&P500 Emini futures candlestick chart has had unusually big swings with no pullbacks over the past few weeks. An increase in volatility like this often happens just before a breakout so this might be a sign that the Emini will break out in August. However, until there is a breakout, there is no breakout, and every one of these strong rallies and selloffs is likely to fail. One ultimately will succeed, but it is impossible to know in advance which will be the one that leads to a trend. Trading range traders have correctly been betting that every breakout attempt will fail. They have been buying low, selling high, and scalping (Fast Money trading).
Someone learning how to become a day trader should not be in denial when the breakout comes. It will be in the form of many consecutive trend days. While within the trading range, traders bet that strong legs up and down will exhaust themselves within a few days. When the Emini changes to trend mode, the swing will continue for many days after beginning traders think it should have at least pulled back. Don’t be in denial. Trade the price action in front of you, not the price action that you think is more logical, but not yet present.
Traders can see the end of the day bar-by-bar price action report by signing up for free at BrooksPriceAction.com. I talk about the detailed Emini price action real-time throughout the day in the BrooksPriceAction.com trading room, and a 2 day free trial is available.
When I mention time, it is USA Pacific Standard Time (the Emini day session opens at 6:30 am PST, and closes at 1:15 pm PST). You can read background information on the intraday market reports on the Intraday Market Update page.


Hi Al,
Last day of July was an awfully wrong for me (Eur/Usd) . After 2 bulish legs at the end of Asian session, I expect continuation and bought pulbacks but it proved to be a bearish swing. After that When I suffered several losses on buys, I changed my sentiment and tried to sell bullish pulbacks. But this pulback became continuation of bullish leg. Hoping for the 2nd bearish leg I kept my growing losses. During US session There was incredible spike for 140points for just 45minutes and I was almost dead..
Al, I have an impression that some big institutions made such things (fistly one direction , then opposite, and finally opposite to opposite direction) to trap stupid guys like me. And what do you think about this frequent change of directions?
Thank you in advance!
Neither you nor I have enough money for an institution to care about us. They are trying to take money from one another. The market usually has to go too far in one direction before it knows that it went far enough.
In general, when the market is reversing every 10 bars or so, traders should assume that the market is in a trading range. It is easy to look at the past 5 bars and see a lot of momentum. People are naturally hopeful and want to believe that each one of these strong moves is the start of a trend. However, when the market is not yet clearly in a strong trend, this sharp moves are far more likely to be vacuum tests of support and resistance.
It is far more profitable to assume that each one will fail, no matter how strong it is. Until the market clearly and strongly breaks out, it has not broken out, and traders will have a difficult time buying high and selling low. It is usually much better to look at a strong rally and then assume it will fail and reverse, and look at a strong selloff and start to look for buy setups.
Al,
Probably I need to do all the mistakes to understand markets so deeply as you do and to feel them by skin.
One more question, please – How long time after session opening you do not trade and just watch the market if any?
Thank you!
Hello Al,
2065 was supportive instead of capitulative, I took off more than half there. Now I have been stopped out of the remainder. Very puzzling times, as on one hand some expect a correction on the other the trading range is holding.
Other than the Greek debacle price action (pa) most likely would have broken out of the top already. So it seems more likely we get a top break out. Personally I am done with trading it. I will only enter once we get a one way confirmed “always in short market” Out of curiosity only …. I wonder who in their right mind keeps the market up so overbought and for so long? Of course I don’t lie awake at night wondering but more of a psychological angle of interest.
Markets continue up until the last bear finally buys back his shorts. The strong bears will never buy back, and will sell the new high. Strong bulls eventually decide that the buying is too extreme and then only buy lower. We are close to that point because we have only been more overbought than this one time in 50 years. That tells me that the strong bulls are close to taking profits and waiting TBTL (10 bars, 2 legs) down on the monthly chart before buying again.
I always assume that a TR will continue forever, and I therefore always take quick profits in a TR until there is a successful BO. Traders who have done that this year have made a fortune. They B L, S H, and SCALP! A scalp on the daily chart is a fast month trade where they hold for a few days until they have a reasonable profit. They do not hold, thinking that they are entering the breakout early with the goal of reducing risk. They pay attention to probability and know that no matter how strong a leg in a TR is, and no matter what logic they use to convince themselves that this leg will be the one that will succeed, it is still likely not to lead to a BO.
As I have been saying all year, I believe the BO can go either way. If the bulls win, I think that they fail within about 5 bars on the weekly chart, which has a very tight TR. This means that the market will either go down this year, or briefly up and then down. It is extremely unlikely that it will set the record and stay above the monthly moving average for more than 44 months (Feb, 2016 is the 44th month) because this is now late in a bull. The record was set early in a bull, which is likely to have a bigger, longer rally. Also, that initial bull BO in 1995 was extremely strong, and stronger than the current rally from 2009.
Al,
I can appreciate your point of trading the trading range as BOuts have a history of failing until they finally do BO. In your reply you emphasize to trade what you see and this is the best advice. What some traders struggle with is their discretion and instincts which they develop over the years. I can tell you from mine and you will agree on a monthly chart the OB condition is so ripe for a correction it’s palpable. We have had 5 months of churning with less and less likelihood of a break out to new highs. Surely those that are holding the core long positions that hold this market up can see the writing on the wall ?
Well according to TR mantra it’s time to get short again we are once again at the top.
The bulls only know that they have gone far enough after they have gone too far. That is why I think there is a 50% chance of a bull BO. It is not clear that they have gone too far in terms of price, and they may need one final new high first. It is clear that they have gone too far in terms of time, and that means that the bear BO can happen without one final new all-time high. It is a 50-50 bet.
The Emini is near the top of the TR and if the bulls cannot get their BO, they will sell out of longs and bears will look for sell setups for a test down.