Monthly S&P500 Emini futures candlestick chart: Strong bull trend, but now in tight trading range
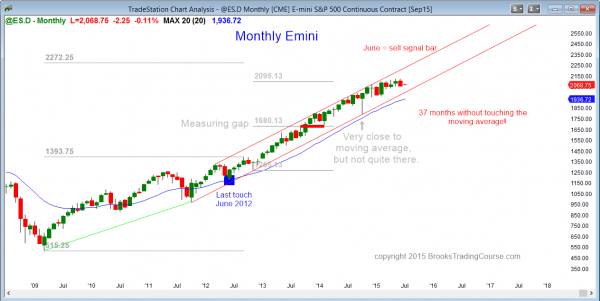
The monthly S&P500 Emini futures candlestick chart had a strong bear trend bar last month, which is a sell signal bar in a buy climax.
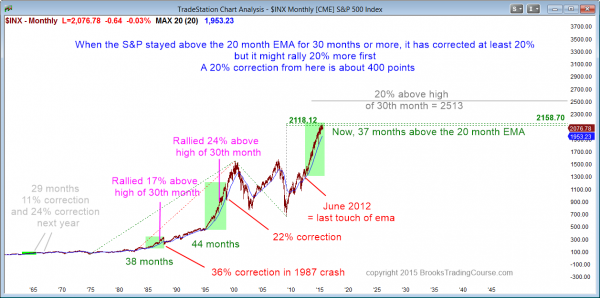
The monthly S&P500 cash index candlestick chart is in its 37th month without touching its moving average. The only other times when it has not touched the moving average in 30 or more months were in 1998 and in 1987.
The monthly S&P500 Emini futures candlestick chart is still in a bull trend, but 37 months above the moving average is extreme and unsustainable, and therefore a buy climax. A reasonable goal for a correction after a climax is TBTL (Ten Bars Two Legs) sideways to down. This is about a year. It can reach the moving average by simply going sideways, but this would require at least 5 more bars. That would make more than 40 months without touching the moving average, and I think that is unlikely for a buy climax forming this late in a bull trend.
There is an 80% chance that the correction will begin this years since the climax already has almost as many bars at the 1987 climax. The odds of it getting 44 bars, like it did in 1998 are small because that was at the start of a huge bull trend and the current occurrence is late in a bull trend. The only signs of a top are last month’s bear trend bar, which is a sell signal bar, and the tight trading range of the past 6 months, which has reduced the slope of the bull trend and it often happens before a correction.
Weekly S&P500 Emini futures candlestick chart: Tight trading range and breakout mode
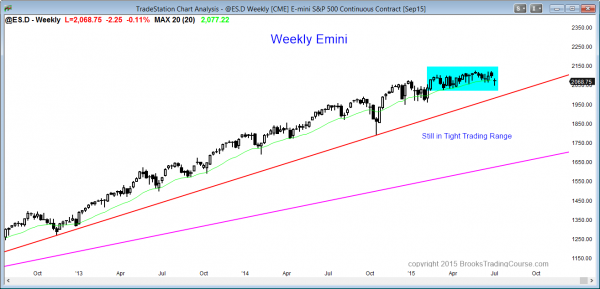
The weekly S&P500 Emini futures candlestick chart is still in its 6 month tight trading range and in breakout mode.
The weekly S&P500 Emini futures candlestick chart is showing no sign of a breakout. The chance of a bull breakout is the same as for a bear breakout. If there is a bull breakout, the bulls will try for a measured move up, but the rally will probably reverse and the tight trading range will then be the final bull flag.
Daily S&P500 Emini futures candlestick chart: Extremely oversold sell climax within a monthly buy climax
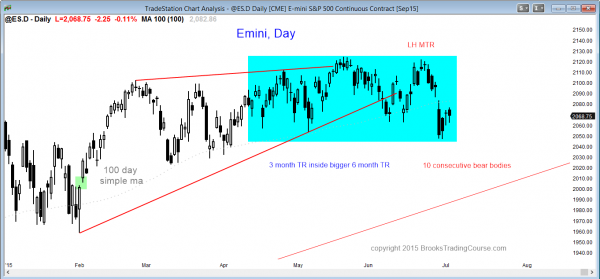
The daily S&P500 Emini futures candlestick chart has extremely unusual price action. It has had 10 consecutive bear bodies, which happens only about once every 10 years. It is a type of sell climax.
The daily S&P500 Emini futures candlestick chart has had 10 consecutive bear trend bars, which is unsustainable selling pressure. There is an 80% chance of a bull bar on Monday, even if there is a big gap down below the 6 month trading range. The 10 consecutive bear bars include a couple of dojis bars, and it is not in a bear micro channel. This means that the selling is not as extreme as it could have been. However, it is a lot of bear bars and therefore climactic. This means that the odds o a bull bar and at least a few sideways days is very high.
There were 10 consecutive bull bars in February, but they were in a strong bull channel, which increased the chances of a deep pullback. The reversal down was to about the midpoint of the rally and lasted about 10 days. Since the monthly chart is so overbought and a 10% correction can begin at any time, this series of bear bars on the daily chart increases the chances of a bear breakout soon.
When a market is in a trading range and then breaks out, it often has a series of trend bars just before the breakout, and that series is a warning to astute traders that the breakout might be underway even before it actually occurs. Professional traders are aware that this might be happening now, and they will be ready for a bear trend starting next week. Will it occur? Probably not because most breakout attempts fail. However, when they do succeed, this is how they often look right before the breakout.
Traders can see the end of the day bar-by-bar price action report by signing up for free at BrooksPriceAction.com. I talk about the detailed Emini price action real-time throughout the day in the BrooksPriceAction.com trading room, and a 2 day free trial is available.
When I mention time, it is USA Pacific Standard Time (the Emini day session opens at 6:30 am PST, and closes at 1:15 pm PST). You can read background information on the intraday market reports on the Intraday Market Update page.


