Monthly S&P500 Emini futures candlestick chart: Strong bull trend, but buy climax
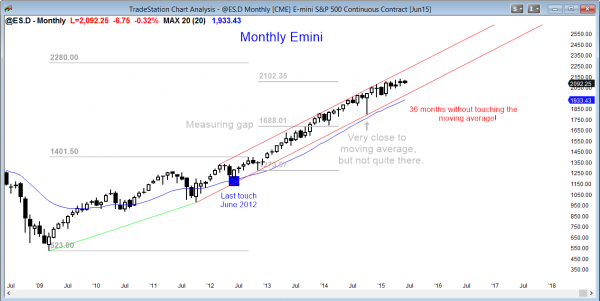
The monthly S&P500 Emini futures candlestick chart has been above its moving average for 36 months, and this is extremely unusual. There is about an 80% chance of a pullback this year to the moving average, which is about 10% below the high.
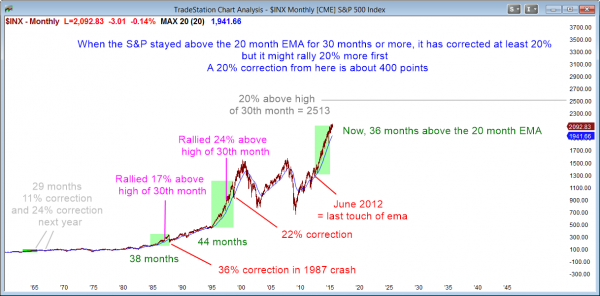
The monthly chart of the S&P cash index has now been above its moving average for 36 months, just 2 fewer months than in 1987.
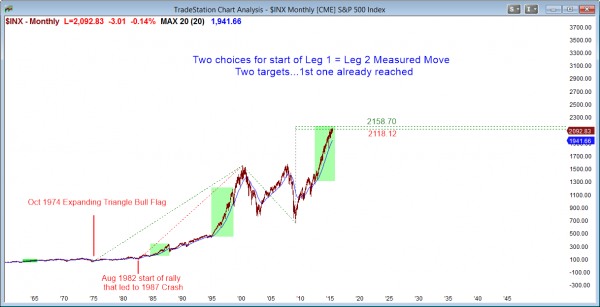
There are two choices for the start of Leg 1 in a Leg 1 = Leg 2 Measured Move projection. The Emini has reached the first target and has come very close to the second one.
The monthly S&P500 Emini futures candlestick chart is extremely overbought. While there has not been any significant selling pressure, making a crash very unlikely, this rally is extreme and the odds are maybe 80% that the Emini will pull back to its monthly moving average this year, and probably 60% that it will do so within the next few months. There is no sign of a top, and the small pullback bull trend keeps growing. However, this is a very dangerous market to be long, unless a trader is comfortable deciding what to do during a 10 – 20% correction.
Weekly S&P500 Emini futures candlestick chart: Wedge top, but still in tight trading range
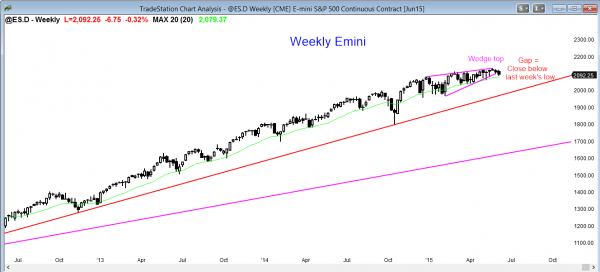
The weekly S&P500 Emini futures candlestick chart is turning down from a wedge top, but has yet to have a strong bear breakout.
The weekly S&P500 Emini futures candlestick chart’s close this week was below last week’s low, and last week’s close was below the low of the week before. Although these 2 bear bars are not big, these gaps are signs of selling pressure. They are telling traders that the odds of a bear breakout are increasing. Until there is a bear breakout, it is still more likely that the Emini will continue within either its 3 or 6 month trading ranges. However, traders need to be ready for a change in the character of the market’s price action from a bull channel into a trading range, with the bottom possibly being all of the way down to the October low.
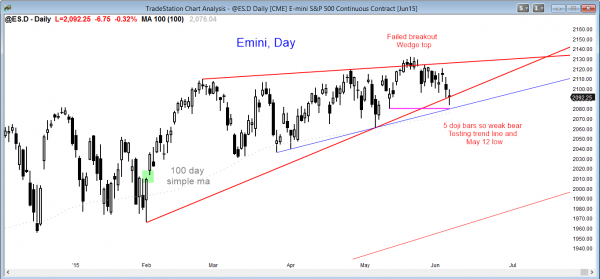
Daily S&P500 Emini futures candlestick chart: Turning down from a wedge top, but no strong bear breakout yet
The daily S&P500 Emini futures candlestick chart is testing the bottom of its bull channel. There are 5 consecutive doji bars in this bear leg, which is more likely in a bear leg in a trading range than in a bear trend.
The daily S&P500 Emini futures candlestick chart is weaker than the weekly and monthly charts. Although it has sold off for several weeks, the last 5 days have been doji bars. This price action is more common within trading ranges than in bear trends. The bears need a strong bear breakout with follow-through selling. Without that, bears will continue to be quick to take profits, bulls will continue to buy as the Emini falls, and the flat, broad bull channel will continue.
The Emini is now at the bottom of a bull channel and the selling has been weak. The odd are that it will bounce soon. However, since the weekly moving average is just below this week’s low, it might have to fall to it before it can reverse. Because the monthly chart is historically overbought, traders have to be ready for a bear breakout at any time. There might be one more new high before the bear reversal takes place, but the odds are very high that the Emini will test down 10% this year.
Traders can see the end of the day bar-by-bar price action report by signing up for free at BrooksPriceAction.com. I talk about the detailed Emini price action real-time throughout the day in the BrooksPriceAction.com trading room, and a 2 day free trial is available.
When I mention time, it is USA Pacific Standard Time (the Emini day session opens at 6:30 am PST, and closes at 1:15 pm PST). You can read background information on the intraday market reports on the Intraday Market Update page.


Hi All,
You mentioned a failed wedge developing with the EURUSD pair on the 1H chart last week. I took the short after the breakout pullback; unfortunately I got out after the first leg down. Never thought that the NFP report would be the catalyst for the bigger second leg down, testing the wedge base. Should have held a small position short despite the strong pullback after the first leg.
Thank you,
Rein
You often talk about scalping for 1pt or 2pts and taking profits at 1x actual risk when the trade is a scalp. What happens if 1x actual risk is sth other than 5 or 10 ticks?
Let’s say it is 7 ticks. Would you scalp for 1 pt or 7 ticks exactly?
Traders need a reason to take profits, and actual risk is one of many good choices. Since most traders will only take a trade that is 70% or more certain out of luck rather than out of knowingly taking it, traders should assume that the best they can do is be 60% right. Because a trader should assume that he is not better than 60% until he has clear proof that he is, the math says that a trader needs to consistently take at least 1x actual risk when scalping, no matter what the size of that actual risk.