Will 2014 be up or down on the year?

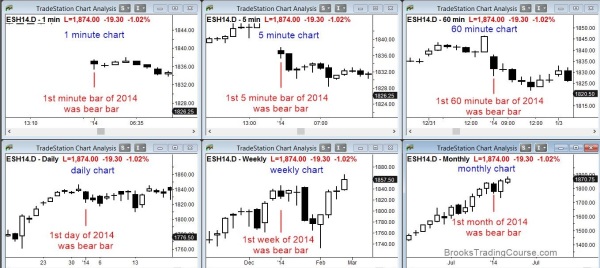
Sometimes something that happens early gives a clue to what will happen late. The year is coming to a close and the first bar of the year on every time was a bear trend bar.
I always say that the close of the bar is the most important piece of information that a bar provides. Will the bar be a trend bar up or down, or a trading range bar? No one knows for certain until the bar actually closes, and bars often change their appearance dramatically just before they close.
2014 is getting close to ending, and soon TV pundits will begin to discuss whether it will be up or down. What they mean is whether this year’s final price will be above last year’s final price.
No one trades yearly charts and therefore they are not important. However, if I were talking about a smaller time frame, I would also want to know if the close of the candle was above the open of the candle because this tells me who owned the bar. Will the bar have a bull body or a bear body?
I often talk about context. Context is all of the bars to the left, and they influence what the bars to the right will look like once we finally get to see them. This is the basis of technical analysis, which is founded on the principle that there are repeating patterns in the stock market and human behavior. What happened influences what will happen.
Every year near the end of the year, TV pundits begin to pay attention to whether the year will be up or down, and they then produce statistics. Because the math is not dramatic, it is really not that important, but it is still fun to consider.
It’s only a matter of time before the TV pundits realize that the first day, first week, and first month of the year were all down. In fact, the first hour and the first 5 minute candle were also bear bars! Even the first minute was a bear candle! Does all of this presage a down year? Who knows, but I think that it is interesting, and I think that everyone will begin to realize it and talk about it. The statistics will come out soon.
Here are mine:
The year is up 67% of the time and down 33%.
If the 1st 5 days of January are up, January is up 76% of the time. However, all months are up 65% of the time, so this is only a small improvement.
If the first 5 days are negative, Jan is down 60% of the time, instead of only 35%.
If January is up, the year is up 82% of the time, and the average gain from Feb –Dec is 8.5%.
If January is down, the average gain from Feb –Dec is only 1.7%, and the year has a 58% chance of being down, instead of the usual 33%.
Here is my YouTube discussion of the January effect:
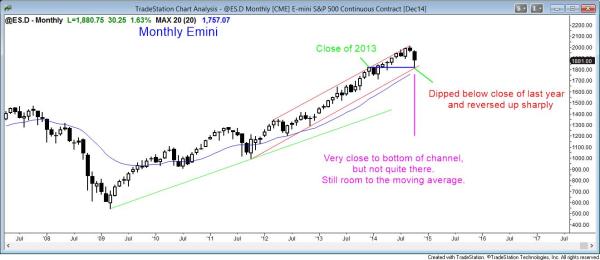
The monthly S&P500 Emini candle is finding support at the bottom of the bull channel

The monthly Emini chart is finding support at the bottom of the bull trend channel and at the close of last year. There is still room to the moving average
The monthly Emini chart was exceptionally overbought, as I have discussed repeatedly over the past couple of months. The stock market sold off sharply and recovered some at the end of the week, but it did not yet reach the moving average. Although the bull trend can continue up from here, the selloff got close enough to the moving average that I think that the stock market will not be able to escape its gravitational field. This means that the market will probably touch the moving average within the next few candles (months). It can do so by going sideways or down.
The reversal up this week was after dipping below the close of 2013. The bulls are trying hard to keep 2014 as an up year. However, there is still plenty of time left for the stock market to test last year’s close and for the year to close below last year’s close.
Since the monthly chart had been in a small pullback bull trend prior to this month, and that is a very strong type of trend, the odds of much lower prices over the next month or two are small. However, if the market beings to create bear candles on the monthly chart, then the selling pressure that it would represent could increase to the point that a bigger selloff could follow. Right now, the moving average is at 1,769. Since it is steeply rising, if the Emini takes a couple of months to get there, it might be at 1,800 when the test finally occurs.
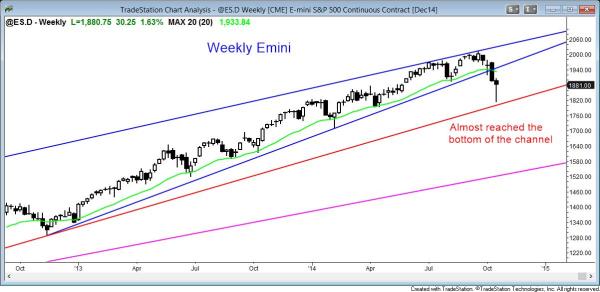
The weekly S&P500 Emini candle chart had weak follow-through after last week’s strong bear breakout below the moving average

The weekly Emini chart reversed up from just above the bull trend line, but it has a bear body.
The weekly Emini chart formed a reversal candle this week, which means that its close was in the upper half of the candle. However, it still had a bear body, and it is following a big bear bar. This reduces the chances that the market will up to a new high without a pullback first.
The weekly candle is the first bar with a high below the moving average in about 80 bars. This makes the bar a moving average gap bar. When one forms late in a bull trend, the rally that follows is usually the final rally of the bull trend before a major trend reversal forms. For the high to be below the moving average, the bears had to be strong. Once they are that strong, they are usually strong enough to create a major trend reversal on the next leg up. Most major trend reversals, however evolve into trading ranges and not opposite trends. However, about 40% of them go far enough for a good swing trade.
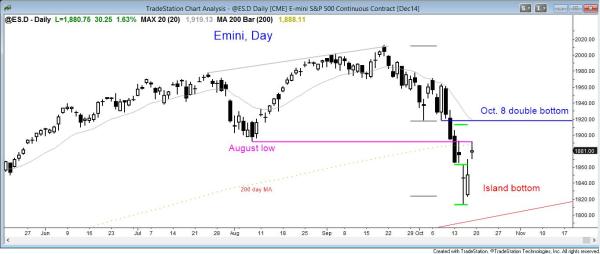
The daily S&P500 Emini candle chart has a two day island bottom: swing trading the island bottom on the daily chart after the sell climax

The daily Emini broke reversed up from a sell climax with an island bottom.
Bulls with be swing trading the island bottom on the daily chart after the sell climax. The Emini gapped down on Wednesday and then up today. This created a two day island bottom, which is a sign of buying pressure, and it is usually followed by a measured move up, based on the height of the island. The projection takes the market to just below the October 8 double bottom. The breakout below that double bottom was the start of the sell climax, and it is the breakout point. The current rally is therefore a breakout test.
Although there is an island bottom, today was only a doji candle, which is a one bar trading range and not a strong bull trend bar. This week follow-through is a sign that the current two day rally is not yet strong. It might never get strong and it might become a bear flag. The 60 minute chart today had a moving average gap bar, which means that one or more bars had a low above the moving average. Although this typically is followed by a test of the bear low and then a major trend reversal, the daily island bottom makes that less likely.
The Emini had been in a trading range on the daily chart for 4 months. Although this selloff is a strong breakout below that range, it might end up as simply an enlargement of the range. The April 11 higher low might be a target where the Emini might finally base. That would be around the monthly moving average and below the weekly channel, both of which are support.
If this is simply an enlarged trading range, this selloff might be the low. The first leg down was to the October 8 low, where the market attempted to form a double bottom bull flag. The current leg is the second leg, and it is a bear breakout. In trading ranges, the market often has a second leg that is a strong breakout, but that breakout is usually a sell vacuum test of support that traps bears into selling to low. It also traps bulls out because they want a bottom that ha more buying pressure.
The bear breakout is strong enough so that the probability favors a test down once the current rally reaches resistance above, like the moving average, the October 8 low, or measured move targets. The bulls have lower probability, but lower risk and greater reward. The strong monthly chart limits the reward for the bears. Also, the stop for the bears is above October 8 high, which is further that the stop for the bulls, which is below Wednesday’s low.
Both the bulls and bears have reasonable arguments. When that is the case, bulls tend only to buy low and take quick profits, unlike in a bull trend when they are willing to buy high. They will also scale in lower, since they are not certain where the bottom is, but are confident that the downside is limited. The bears will only sell rallies, and they will take profits on tests of the low. When both the bulls and bears buy low, sell high and take quick profits, a trading range forms. That is what is most likely on the daily chart.
This is also true of the weekly chart as well. The selloff was strong enough so that a second leg down is likely before the Emini reaches a new all-time high. It is also consistent with the monthly chart. It still has a target below (the moving average) and this limits the upside. Since the monthly bull trend is so strong, this limits the downside. The result will probably increase the chances of a trading range. Although the forces are different on the three time frames, they all are generating trading range pressure.
Traders can see the end of the day bar-by-bar price action report by signing up for free at BrooksPriceAction.com. I talk about the detailed Emini price action real-time throughout the day in the BrooksPriceAction.com trading room, and a 2 day free trial is available.
When I mention time, it is USA Pacific Standard Time (the Emini day session opens at 6:30 am PST, and closes at 1:15 pm PST). You can read background information on the intraday market reports on the Intraday Market Update page.


“What happened influences what will happen.” is a great say, and probably qualifies to be the trade-marked/copyrighted statement on the Price Action webpage that the fans maintain. Thanks for so much analysis. I simply do not know how you get time and energy to help us without anything in return. Again thank you. One comment I would like to add, if I may, and I might be incorrect.
Oct 15 low (1820) seemed to test the low of Apr 11, (1814) as a double bottom. The upcoming second leg down, after the current rally is over, and probably after some more consolidation, if it happens, is likely to target (my personal opinion): the band of 1730-1740, which served as support for Feb 3, 2014 low (1739) and as resistance for Sep 19, 2013 high (1729). The program trading seems to add anomalies in its algorithms to create bear traps and bull traps. It is difficult to know what is truly targeted, so as it nears the band, probably one should not stay complacent for the arrival of near 1700. In other words, the test point can be fluid.
There are several measured move projections around the Feb. 3 low of 1710. Although no one is talking about it, that currently is the most important downside target on the chart because there is a gap between it and the Sept. 20, 2013 high on the weekly chart. This selloff might get down there to test that gap. The bulls obviously want a double bottom. I believe that the monthly chart has entered a trading range and it might continue for months or even years. We know where the top is. The market is looking for the bottom.
Yes, it is a reversal bar and I mentioned that above. However, it has a bear body and it does not look as strong as the bear trend bar before it. That makes a lower high and 2nd leg down more likely that a resumption of the bull trend.
Hi Al, there is a signal bar on the weekly. But, I got a feeling this signal bar is not valid and the market most like to revert back by the end of next week