Monthly S&P500 Emini futures candlestick chart: Bull flag at the moving average
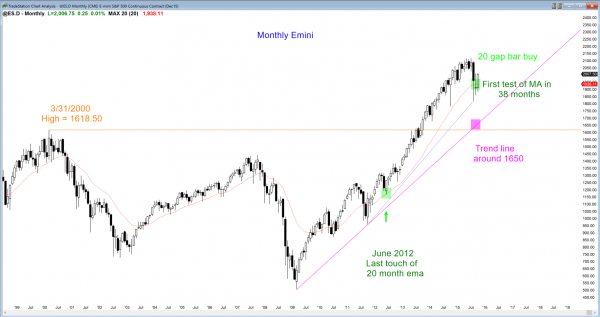
The monthly S&P500 Emini futures candlestick chart is holding above the moving average after the first pullback to the average in 38 months.
The monthly S&P500 Emini futures candlestick chart has tried to break below the moving average during each of the 3 past months and continues to fail. September formed a bull inside bar and a buy signal bar. Since it is a big doji, the odds are that there are sellers above, and a breakout above last month’s high will probably not go far. Instead, a trading range is likely to begin to form.
Weekly S&P500 Emini futures candlestick chart: Double bottom with August low and with last October’s low
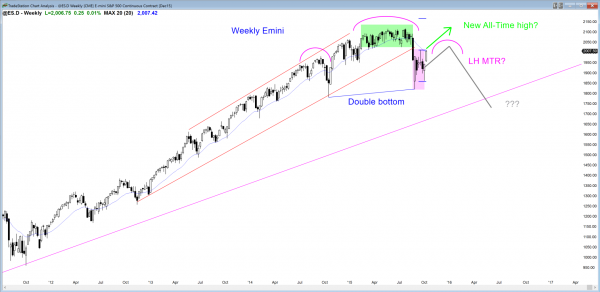
The weekly S&P500 Emini futures candlestick chart had a strong bull entry bar this week after gapping above last week’s strong buy signal bar.
The weekly S&P500 Emini futures candlestick chart had a good week for the bulls. The bulls want a strong follow-through bar next week, with a close far above the September high and the moving average. Whether or not they get what they want, the reversal up over the past 2 weeks has been strong enough so that bulls will probably buy the first reversal down. This means that the best that the bears can reasonably hope to see over the next couple of weeks is a pullback, maybe to test the gap below this week’s low.
Last week’s low formed a double bottom with the August low, and the September high is the neckline of the double bottom. The bulls want a strong breakout above then neckline. A measured move up would test the all-time high.
The August low formed a double bottom with last October’s low and the neckline is the all-time high. A measured move up, if the bulls were able to get it, would be several hundred points higher. It is more likely that the rally would stall in the 7 month trading range that ended in August. After many months, the market would decide between the bull breakout and a big double top.
The bears want this week’s rally to form a double top bear flag at the moving average with the September high. They hope this rally is simply a buy vacuum test of the resistance of September high. They then want a reversal down, which would form a double top bear flag with the September high.
The bears want a strong reversal down next week, hoping to create a double top bear flag with the September high, but they know this will probably not happen after 2 strong weeks up. Alternatively, they might be able to halt the buying and create a small trading range. They then would try to make a a micro double top within the tight trading range, which could lead to a test down to the gap below this week’s low, and possibly even a bear breakout below the August low.
Daily S&P500 Emini futures candlestick chart: Learn how to trade the markets at the top of the trading range
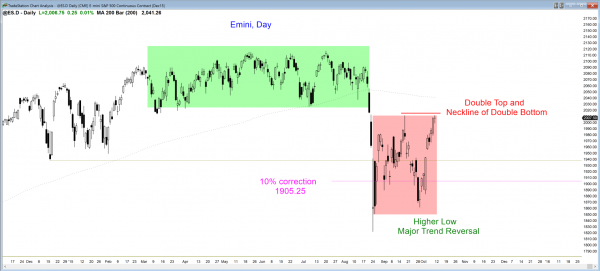
The daily S&P500 Emini futures candlestick chart is testing the September high. The rally is strong enough so that the first reversal down will probably be bought.
Before this week, the daily S&P500 Emini futures candlestick chart had a 60% chance of any rally being a bull leg in a 2 month long bear flag, which would soon be followed by a 2nd leg down. The rally has been strong enough so that those who trade the markets for a living now believe that the odd of a test of the all-time high have risen to 50%. The bulls need a strong breakout above the top of the trading range. While they prefer that the breakout comes next week, they are confident that if the Emini begins to turn down from the double top with the September high, the bulls will be strong enough to rally back up for another attempt at the breakout.
Because the rally has not yet broken above the top of the trading range, and even strong legs up in trading ranges usually lead to reversals, there is at least a 50% chance of a pullback over the next couple of weeks. This is true even if the bulls break above the September high first.
The 200 day moving average is around 2040, and that will likely be resistance. The rally will probably pull back either from where it is now at the September high or from the 2040 area. If the Emini reaches the 200 day moving average, the bears will see a reversal down from there as an expanding triangle bear flag with the August 28 and September 17 highs. The bears want the double top with the September high.
When a test of resistance comes from a rally as strong as this one has been, a reversal down usually requires at least a micro double top. This means that there will probably be buyers below today’s low and that a reversal down will probably only last for 1 – 3 days before the bulls again try to break above the September high. If they fail again, the micro double top might lead to a small measured move down, which might test the gap below this weeks low. The bears hope that it would continue down and break below the bottom of the 2 month trading range, but they need to create a lot of big bear bars to erase the bullishness of the past 2 weeks.
Traders can see the end of the day bar-by-bar price action report by signing up for free at BrooksPriceAction.com. I talk about the detailed Emini price action real-time throughout the day in the BrooksPriceAction.com trading room, and a 2 day free trial is available.
When I mention time, it is USA Pacific Standard Time (the Emini day session opens at 6:30 am PST, and closes at 1:15 pm PST). You can read background information on the intraday market reports on the Intraday Market Update page.


Well I’ve covered a few topics which I now have your opinion on, which is great.
You have just about covered every possibility that may happen for the next week. At some point in time all traders have considered C/theories, they are that bit of fun that compliments the realities of trading.
P/A at the 2045/50 area will be key to watch.
Just on the topic of forward thinking the potential moves on the market, this is an actual skill that helps prepare a trader to better react when the time comes. If they can closely preconceive the potential “bear and bull” scenarios, then they have that contingency plan to react accordingly. I mention this for anyone else reading.
On another note … can you imagine if we make news highs before Dec ! now that would blow me away. Expect the Unexpected
Hi,
On the subject of what was mentioned below …
“The strongest rallies, like this one, often happen in bear trends, and are followed by even stronger bear trends.”
If I can see a transition pattern at said levels then all would fit the story.
It would be out of the blue without some type of transition first EG: a period of change or distribution. I’m asking here … a “V” top would not happen would it, barring any sudden macro event ?
If we don’t have any pattern and no news event then it is more likely to move past 2045 level to top of trading range. I can say with certainty that if there is some kind of major event at said levels then we are in for a heck of a ride down.
In saying the “bulls have broken above several resistance levels and prevented the bears from getting the 2nd leg down’. This is the part that fascinates me, who are these players ? Is there a collusion among the big names ? Obviously I will never know but there was the strong break out followed by strong buying. Not one single bear got even a chance, think about that for a moment ! How does this system really work, surely some type of group participation. That’s why if your running scared while trading the market you will be the few that survive, willing or having to flip at a moments notice.
V tops and bottoms are so rare that they are not worth discussing. They are almost always something else, like a small Final Flag reversal. As I said, I believe there will be a PB this week and it will be bought. The bulls might only get 1 or 2 days up before the bears take control, if they can take control. It would be extremely rare for the market to reverse down without at least a micro double top. Once that top forms, which it probably will this week, the bears then have a possible top. However, the rally has been so strong that even a 10 day selloff will probably be bought. The bears will probably need a major trend reversal over the next few weeks, or at least a micro double top followed by an endless PB from the bull trend, and then a bear BO below the bear channel. However, they still have a 50% chance of a top in this area and up to around 2050. As I said, so many now believe that the bottom is in that if this starts to go down, is could go down very fast as the shocked bulls try to exit will a minimal loss.
Conspiracy theories are popular in all endeavors, and someone who works closely with me believes that they are common in the stock mkt. I have to remind him to take his medicine regularly so that he will not experience these delusions so often.
Besides the legal exposure, it simply does not make sense that a group of firms that was big enough to move the mkt any way they choose would ever do that. The group would have to be so big that there would not be enough money on the other side. Also, so many people would be involved that they would be discovered and prosecuted severely, and they and their families would be disgraced.
Even though the executives want to make as much money as they can, and many are comfortable walking close to the line of criminality, the vast majority of top people at the big firms would never consider conspiring. Yes, there is the legal reason, but beyond they, they have a tremendous respect for the mkts, and it is their turn to be responsible caretakers. It would be unimaginable for most of them to ever do anything that big, which they know would hurt the integrity and reputation of the mkts for decades. Also, it would hurt America in a very big way, and they just would not do it. They want to be responsible citizens and they take pride in what they do. To expect dozens of them to get together to soil their nest is unfathomable. I have known a lot of powerful business people, and they are really good people. They would go after any crook extremely aggressively. My daughter is getting her MBA from Harvard Business School. I met a lot of her friends at Harvard. They are an incredibly great group of people. They would never let anyone get away with a conspiracy.
It’s a mkt. Each of us is trying to take money from everyone else. The big firms want to win. MS wants to beat GS, C wants to beat JPM. When they can consistently make huge incomes, why do something that would only provide a relatively modest profit and have it come with huge legal risks? It’s simply far more fun to make a fortune honestly if you have the ability to do it, and the big firms have that ability.
Hi Al,
Thanks for your thorough analysis, probably takes a while to put it together.
A small 20 pt pullback early next week followed by a bull attempt to break 2045 area could very well be in the cards.
If we get a trading range there and only a false break but no close candle above 2045 then we could be set for another leg down as you’ve mentioned.
BUT this weeks candle is certainly strong so the question on everyone’s mind is are we in a “correction or an up continuation”. All will be reviled at the 2045 level.
The pullbacks from the 1880 area have been minimal indicating bull power.
I’ve wondered if this rally has been more “short covering” or “genuine buyers”
It seems more genuine buyers as there has only been 2-3 candles that have not closed on their highs. (daily chart)
As you’ve mentioned and I have thought prior I’m waiting to see a D/T or failed retest as a confirmation for a reversal.
Lets see what happens at 2045 P/A will reveal all.
I think it is fascinating, and the strength of this rally sets up the potential for a very big, fast selloff. The bulls are heavily committed and confident. They have broken above several resistance levels and prevented the bears from getting the 2nd leg down. No one knows yet just how much money the strong bears are willing to commit to hammer this down, and no one knows where they will enter. 2045 in the cash index is at the bottom of the 7 month TR, and it looks like the rally will test the 2050 area, maybe after a pullback. Will the bears come in and destroy the bulls, or will they wait to sell at a new all-time high or higher? We should find out in the next few weeks. If there are a lot of very strong bears just waiting for the right price, the move down could be shocking. The strongest rallies, like this one, often happen in bear trends, and are followed by even stronger bear trends. I think the bulls did enough over these 2 weeks to increase their chances to 50%, which is the goal of every market. Markets try to quickly move to neutrality.