Monthly S&P500 Emini futures candlestick chart: Buy climax, but not yet high probability trading for the bears
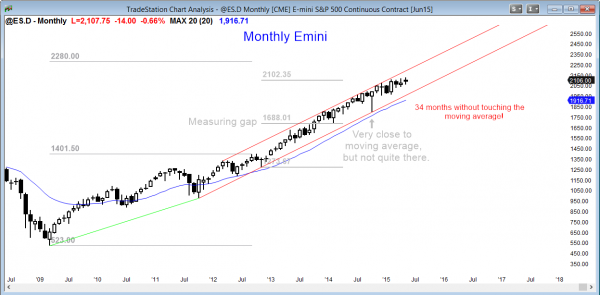
The monthly S&P500 Emini futures candlestick chart is in a small pullback bull trend, but the past 7 weeks have been essentially in a tight trading range that is sloped upward.
The monthly S&P500 Emini futures candlestick chart is extremely overbought. Monday will be the start of the 35th consecutive month without touching the 20 month exponential moving average.
The S&P cash index has only been above this average for more than 30 consecutive months two other times in the past 50 years. The last time was in 1998 when it stayed above for 44 months before correcting 22%. However, that was at the start of a bull trend, and the current rally is late in a bull trend. It is therefore unlikely to be as strong. The other time was the 1987 Crash. That was late in a bull trend, like today, and it stayed above the average for 38 months before correcting 36%. However, there is no sign of a top and the current rally could continue much longer, but each bar gets closer to the start of the correction.
Since the moving average is about 200 points below the high, the correction will probably be about 10% when it comes. It might go down to the October low.
Weekly S&P500 Emini futures candlestick chart: Candlestick pattern is a Final Bull Flag reversal
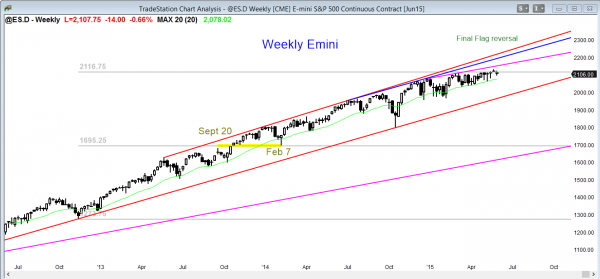
The weekly S&P500 Emini futures candlestick chart is reversing down after a weak breakout above a tight trading range. The reversal down is also weak, and the tight trading range might simply be growing.
The weekly S&P500 Emini futures candlestick chart has been trying to break above its tight trading range for 5 weeks, but has continued to fail. This week was another entry bar for the bears in this candlestick pattern. Last week’s signal bar had a bull body and this week’s entry bar is small. This reversal might be simply adding more bars to the tight trading range instead of beginning a swing down. Until there is a strong bear breakout, the bull trend is still intact. Once there is a bear breakout, traders will see this tight trading range as the Final Bull Flag.
Daily S&P500 Emini futures candlestick chart: Learn how to trade a wedge top
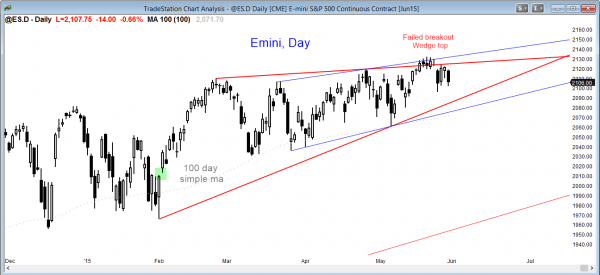
The daily S&P500 Emini futures candlestick chart is in a broad bull channel, and it is reversing down from the top of the channel, as it has done many times before.
The daily S&P500 Emini futures candlestick chart had a wedge top this month, and it turned down from a small lower high today. However, the Emini is still in a broad bull channel, and it is failing to have follow-through after either strong bull or bear days. This is typical of trading range and broad channel price action. Until there is a strong bear breakout, the bull trend is intact. It is possible that the bulls might get a strong bull breakout, but a bull breakout above a channel, especially late in a trend, fails 75% of the time. This means that the odds favor a bear breakout, whether or not a bull breakout comes first. Until there is a bear breakout, there is no breakout, and the bull trend is intact.
June has a strong tendency to rally from June 26 to July 5. This is in part due to portfolio managers making sure to buy the best performers of the quarter to show them on their books at the end of the quarter (window dressing). It also might be due to holiday and summer vacation euphoria. The implication of a rally at the end of the month is that there can be a sideways to down move in the middle of the month. With the S&P Emini futures contract as overbought as it is, traders have to be ready for a bear breakout WITH FOLLOW-THROUGH!
There have been many bear breakouts over the past 6 months. What they all have in common is the absence of follow-through. This is expected in a bull trend. If the daily chart falls 200 points, it will be in a bear trend, and the pattern of bad follow-through after big bear days will stop. There will be several consecutive big bear days, no matter how oversold the 5 and 60 minute charts may become. Traders learning how to trade the markets must be flexible, and not deny the change once it comes.
Traders can see the end of the day bar-by-bar price action report by signing up for free at BrooksPriceAction.com. I talk about the detailed Emini price action real-time throughout the day in the BrooksPriceAction.com trading room, and a 2 day free trial is available.
When I mention time, it is USA Pacific Standard Time (the Emini day session opens at 6:30 am PST, and closes at 1:15 pm PST). You can read background information on the intraday market reports on the Intraday Market Update page.


Al,
Not sure if you can answer this, but how do you manage your personal savings?
I mean do you keep them in cash, do you buy bonds/stocks or some gold instead?
Any good advice on how to better protect cash savings?
I am an old guy and have had many opportunities in life. As you can imagine, I do many things, but as a trader, I always have plenty of cash.
People get rich doing all kinds if things and I think it does not matter what one chooses. It is simply a matter of personal preference. Because there are so many emotional fools who love gold, even if it is in a bear trend or it is dead money (tight trading range), I tend to avoid it. If I want to soar like an eagle, I don’t want to hang with the turkeys.
Hi Al,
as you said, any past attempts by the bears to generate a breakout had poor follow through, as seen on your daily chart. The bulls see it as a buying opportunity at a more favorable price. That’s why we see these long wigs on the weekly chart. Isn’t it also possible that we have an extended consolidation phase before the next push higher? It appears to me that these higher lows on the daily chart are creating a squeeze against resistance, and it may only be a matter of time before it breaks significantly to the upside?!
I agree with that and have mentioned that many times. However, I also have said that the odds of a successful bull breakout are small because of the one point that I continue to make…the monthly chart has not touched the moving average in 34 months.
I have traded for a long, long time, and I have never seen a chart stay above its moving average forever, and the odds of it happening now are incredibly small. It would be a once in a lifetime event for me. I acknowledge that black swans exist, but this would be a black polka dot swan with 5 legs and 4 wings, and it would be extremely rare.
I continue to believe that there is an 80% chance of at least a 10% correction down to the monthly moving average this year, and probably more than a 90% chance by the end of 2016. If it took until December 2016, that would be over 50 months, and it would be far more than anything I have ever seen in 28 years as a trader. Does it make more sense for me to think it will happen, or does it make more sense for me to think that it will not stay above its moving average that long?
When I trade, I try very hard to be objective, especially when it comes to assessing probability, and this is my current assessment. I also think that it is so unusual right now that the 10% correction might already be underway with last week’s 60 minute buy climax. We will see.
It would be nice to get a strong bull breakout with a sharp reversal down because that would be easier to trade. However, this looks more like a rounding top, and traders will not believe that the bears have one until there is a strong bear breakout with follow-through. That means that most bears will miss the 1st leg down and will wait to sell the pullback to catch the 2nd leg down.
Al,
It is my opinion that during this uncertain rally to watch for major news events that will trigger not only profit taking but panic selling. I am not short but will certainly not go long here with monthly charts so overbought.
I think it would be wise to have funds ready for a shorting opportunity.
What you said about the last quarter “window dressing” will be interesting to watch too.
It is difficult to go short without a strong sell setup or a strong bear breakout, and it is difficult to do it with options as well because the sideways movement erodes the value of options. However, I was very tempted to buy put spreads on that rally on Wednesday and then again Friday. I suspect that the bear breakout will be soon.
One point I tried to make about the window dressing, and I think I did not make it clear enough, is that it can occur within a bear trend. For example, if the bear breakout is this week and the Emini sells off for several weeks, it could then rally at the end of June, but that rally could end up as a pullback in a bear trend and then be followed by a 2nd leg down.
I personally am holding some cash for long-term stock positions, but I am waiting to buy a 10 – 20% correction.