Monthly S&P500 Emini candle chart: Futures trading strategy is to be ready for a correction
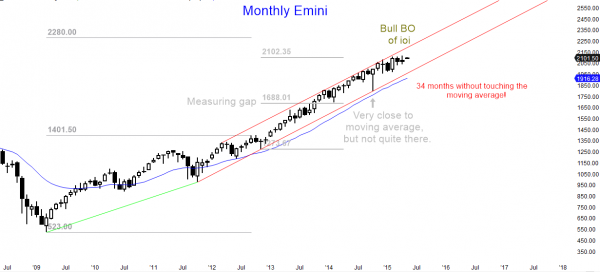
The price action of the monthly Emini candle chart is sideways in a 6 month tight trading range. The bull trend is extremely overbought and will probably correct down to the moving average this year. However, there is no top yet and it might go higher for several more months.
The monthly S&P500 Emini candle chart has not touched the moving average in 34 months, which has happened only twice in the past 50 years. The odds are high that it will correct down to it this year, and there is maybe a 50% chance of it falling to the October low.
What news will cause the correction? It is irrelevant. You cannot make money trading the news. The Emini futures and stock markets will fall simply because the consensus will suddenly switch to the idea that the rally has gone too far. Traders will change their swing trading strategy from the current approach of buying strength to a new approach of selling strength and buying weakness.
This has not yet happened, but with the monthly chart as overbought as it is, the change will probably happen at any time in the next few months. Until then the monthly chart is still in a small pullback bull trend, which is the strongest type of bull trend. It is also in a 6 month tight trading range, which might become the final bull flag before the correction.
Weekly S&P500 Emini candle chart: Swing traders are still buying
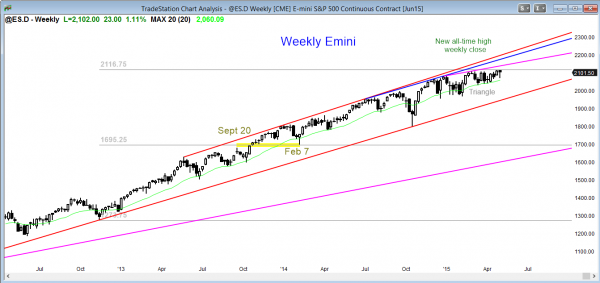
The price action trading strategy for the weekly Emini candle chart is to look for a breakout or a failed breakout of this 3 month trading range. Even though the Emini futures contract is in a bull trend, it is very overbought, and a tight trading range late in a trend is often the final bull flag.
The weekly S&P500 Emini candle chart formed an outside bar this week, but it rallied today back above its midpoint. The bears failed to close this week below last week’s low. This increases the chances that last week’s breakout above the 3 month trading range might still be successful. However, a tight trading range late in a trend is likely the final bull flag than a base that will lead to another strong leg up.
Daily S&P500 Emini candle chart: Price action trading strategy is to be ready for a breakout of the ascending triangle
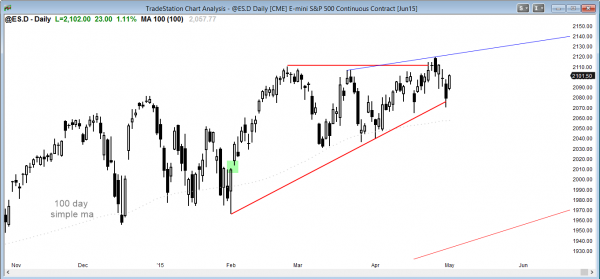
The daily S&P500 Emini candle chart is in an ascending triangle, and the odds favor a bull breakout.
A triangle late in a bull trend is usually the final flag before a correction. Also, if the current 2 day rally fails to break out to a new all-time high, it will form a lower high. On the 60 minute chart, this would be a lower high major trend reversal (head and shoulders top). Traders learning how to trade the markets should realize that most tops are more likely to be bull flags than reversal patterns. However, with the S&P Emini as overbought as it is on the monthly chart, the odds are increasing that reversal will finally lead to a swing trade down. There have been many tops in the past few years, and every one became a bull flag. The odds are that this one will as well. If it does, traders still need to be looking for a top because the monthly chart is so overbought and likely to correct at least 10% this year.
Forex trading strategies: Look for a pullback in the Euro on the 60 minute chart next week
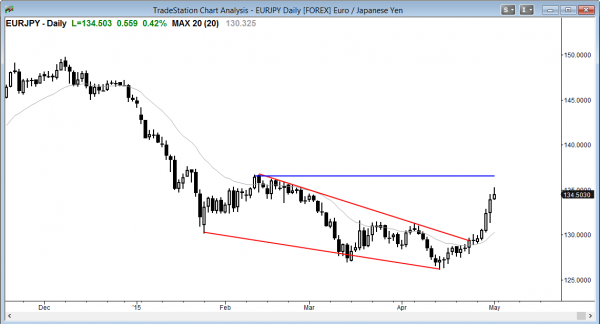
The daily EURJPY Forex candlestick chart had a strong breakout above a wedge bottom. The odds favor a pullback and then a 2nd leg sideways to up to test the top of the wedge bear channel (blue line).
The daily chart of the EURJPY has a strong breakout above a wedge bottom. The Forex trading strategy is to buy a pullback for a 2nd leg sideways to up. Since the rally has been climactic, the pullback might be deep (around 50%) and last for more bars than traders would like. However, a 2nd leg up after the wedge bottom is more likely than a resumption of the bear trend.
The EURUSD rally this week has a series of buy climaxes on the 5 and 60 minute candlestick charts, which creates a wedge top variation, and it will therefore probably correct down and enter a trading range early next week. Traders will begin to look to sell new highs, in addition to buying pullbacks.
Traders can see the end of the day bar-by-bar price action report by signing up for free at BrooksPriceAction.com. I talk about the detailed Emini price action real-time throughout the day in the BrooksPriceAction.com trading room, and a 2 day free trial is available.
When I mention time, it is USA Pacific Standard Time (the Emini day session opens at 6:30 am PST, and closes at 1:15 pm PST). You can read background information on the intraday market reports on the Intraday Market Update page.


Hi Al, would appreciate if you could give us your views on USD Index. Thank you.
KK
On the monthly chart, it raced to the top of the 12 year trading range and reversed. The rally could be a 2nd leg trap in a TR, like 2008, and it was clearly climactic. Because it was climactic, the odds favor a pullback for at least several bars (months). However, the rally had 9 consecutive bull trend bars, and this makes it likely that there will be buyers on any pullback and that the dollar will test the current level after the pullback. The reason I am not more bullish is that it is stalling at the top of a trading range instead of far above the range. This is more common when the upside is more limited, and less common at the start of big trends. In any case, it is Always In Long and this might still be the start of a huge bull instead of a bull leg in a TR. We need more bars to find out.
Hi Al,
Weekend update:
It is a bit confusing that the text below the chart is talking about the EUR/USDn while the chart is the EUR/JPY
Thanks for everything.
Typo. I am always thinking about EURUSD and trade it the most. My mistake. I just fixed it.
Thanks,
Hi Al,
I am interested in your comment (in your Monthly ES analysis) above:
‘What news will cause the correction? It is irrelevant. You cannot make money trading the news.’
I am trading Forex and my entry timeframe is the Daily and 4 Hour charts, with my higher time frame analysis of the Monthly and Weekly charts. I am really attracted to the principle of trading Price Action ALONE but I am constantly drawn to conducting a fundamental analysis – based on a Global Macro Economic analysis including impact of news on interest rates, inflation, sentiment, geo political events, etc. While I do NOT trade the news, I find it a REAL CHALLENGE to ‘align’ all the various fundamental factors and the technicals/price action analysis to take a trade. I am invariably suffering from decision fatique by the time I have completed my analysis – a lot of information for one mind to process – and by then I often do not have the resolve / energy and focus to actually take the trade.
Al, I would be grateful for your own view on my comments above.
With my entry timeframe being the Daily and Four Hour Charts and my higher time frame analysis of the Monthly and Weekly Charts: Do you recommend trading ONLY price action and IGNORING COMPLETELY fundamental analysis? I understand that we must each determine our own trading strategy and setups and as such I am not looking to abdicate my own responsibility in this regard. I am interested in your view.
Thanks,
Hugh
I think that fundamental information is useless. All that matters is what the institutions will do with it. One will see any move as overdone while another sees it as having a lot more to go. Every trade has institutions on both sides. It is impossible to look at fundamentals and then conclude what the majority of institutional dollars would go. If a guy could do that from his home, don’t you think Goldman Sachs could do it as well? If the EURUSD should be 1% higher, it would be 1% higher in 1 second. Institutions are smarter than you and me, and it is their market, not ours. The only way we know if the bull institutions are winning is to look at a chart and see prices going up. They sometimes go down on news that is “bearish.” If it was easy to make money from fundamentals, no one would take the other side of the trade. Why would an institution sell if the fundamentals clearly indicate that the price is going up? If a trader believes he understands fundamentals better than Goldman Sachs or George Soros and their teams of experts, then he should trade fundamentals. I do not believe it can be done. This is why Money in Motion went off the air. Their traders talked Forex fundamentals and sounded like idiots because of it. No one believed what they were saying. I don’t mean to be harsh, but that is the reality. Firms that trade fundamentals have many experts who know much more about fundamentals than simply, “The US will raise rates.” There is never one fundamental, and there are many that are impossible for you to know. Do you know if China needs to buy dollars to build roads in the Congo, or if India needs Yen to build an electrical grid? Do you know if the Saudis have some family squabble and they need to sell gold and buy dollars? There are countless things that you cannot know, but Soros does know. For for a trader to look at one thing and conclude that governments are firms are making decisions based on that one thing that the trader thinks he understands is not credible.
Bottom line…charts are truth. They show us the sum total of all of the votes that each institution and government has.
Thanks Al for your comprehensive answer. You are leaving my in no doubt that fundamental analysis is a complete waste of time for a retail trader. I am delighted that I asked you this question because your answer has just liberated my future trading – I am free to focus exclusively on price action, which I enjoy. My gut instinct kept telling me to just study price action – but I was drawn to fundamental analysis – almost against my will. Maybe I was looking for ‘certainty’.
Al, I have devoured all four of your books and your video course (including the 2014 updated edition and all of which I highly recommend for the serious trader) – and listened to you in your room for many months. You have taught me a LOT and your clarification to me (in this thread) is probably the one piece of guidance that has resonated with me the most. And when I needed it the most.
Many Thanks,
Hugh
Hugh O’ Neill
EURUSD daily chart has broken a triple top (18.3.2015 , 26.3.2015 and 6.4.2015) and it might lead to measure move up based on low of the year .Also trend looks strong with gaps along the way.
https://sc-cdn.scaleengine.net/i/9317c429320d3b58e0765348d94981f7.png
I look at that more as the neckline of the double bottom, but I agree with the conclusion. Strong trends, like that bear, usually transition into trading ranges and not bull trends, so this rally is probably a bull leg in a trading range, and a measured move is a good way to find a possible top to the leg up.
Al, Can you advice? I would like to partly go from USD to EUR with time prospect 6-12 months. All I need that Eur will stay above 1.10 level. Is it in general good time to do it?
Hi, Murat,
There is one BIG thing that the NFA never allows me to do, and that is give individual advice. If you read my comments above, I believe that the current rally in the EURUSD is a bull leg in what will become a trading range. Once a trading range forms, traders will decide if there is a strong reversal pattern within it that should lead to a trend reversal, or if the trend down will continue.
At this point, the odds still favor the bears, but there is no sign that the bear trend has resumed yet. It is more likely that the trending range on the daily chart will continue for at least another 10 – 20 days, and possibly much longer, given how climactic the selling was through March.
Thank you, Al !