Monthly S&P500 Emini futures candlestick chart: Strong bull breakout above double bottom, but still in trading range
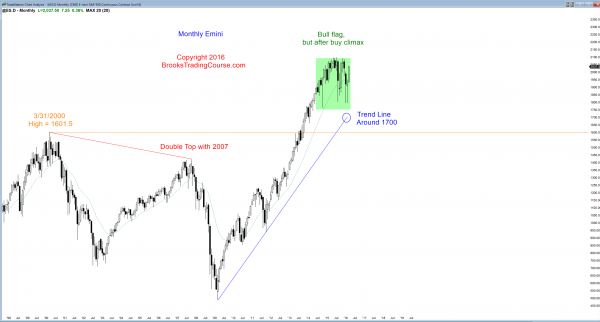
The monthly S&P500 Emini futures candlestick chart this month so far has a big bull trend bar, but the rally is still in the bull flag.
The monthly S&P500 Emini futures candlestick chart has rallied strongly for the past 2 months, but it is still in its 2 year bull flag. That bull flag formed after an unusually protracted buy climax, which reduced the chance of a bull breakout above the bull flag to less than the chance of a bear breakout below. The longer the trading range continues, the more the probability for the bulls increases. After around 20 – 30 bars, the probability for the bulls reaches that of the bears. If this trading range continues for a few more months, that will be the case.
If the bulls do get their breakout to an all-time high, it will come out of a protracted trading range late in a bull trend. The odds are that the trading range would be the final bull flag before a big correction. The bulls might get a measured move up above the trading range before the correction begins, which would be around 2400. However, the odds are that there would be a reversal down from the bull breakout and it will probably last at least a year, and it will probably fall below the trading range. It might test the 2000/2007 double top around 1600.
Weekly S&P500 Emini futures candlestick chart: Strong rally, but buy climax
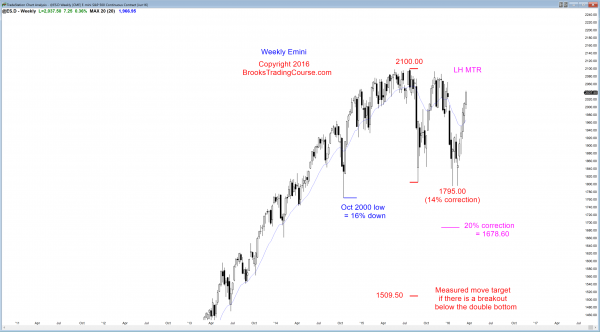
The weekly S&P500 Emini futures candlestick chart has rallied for 6 week’s, and the last 3 have been strong.
The weekly S&P500 Emini futures candlestick chart has had 6 consecutive bull trend bars. That is unusual and therefore climactic. By climactic, I mean that it is unsustainable and the odds are that it will end next week, which means that next Friday will probably close below the Monday open.
If next week is a big bear trend bar, that might be all that the Emini needs for the buyers to come back. If it is simply a small bear bar, the following week might reverse down. However, 6 consecutive bull trend bars represent strong buying. That means that bulls will be quick to buy the 1st reversal down.
Because the stop for the bulls is below the bottom of the bull breakout and that is now far away, institutions have only one tool to reduce their risk. They have to take reduce their position size, which means that they will probably begin to take partial profits next week.
When the bulls begin to sell, a pullback forms, like it did in December, 2014 and October, 2015. The pullback might only last a week or two, or it might last a couple of months. Since this rally has been so strong, bulls who need to add to their position will be eager to buy even a small pullback. Instead of a 100 point trading range beginning within the next few days, a tight trading range is more likely. On the weekly chart, a 40 – 60 point range is tight, and it might be similar to the one that formed in September, 2014.
The market can do anything at any time, and I am never surprised. Can this rally continue up for a 7th and 8th week? Of course, but there is a higher probability that it will begin to pull back next week simply because the weekly chart only rarely has 6 or 7 consecutive bull trend bars.
While this week or next week might end up as the high for the next couple of months, the best that the bears can reasonably hope to see over the next few weeks is a trading range. After that, they might have created enough selling pressure for a bigger reversal down, if the market is going to create one.
Daily S&P500 Emini futures candlestick chart: Learn how to trade consecutive buy climaxes
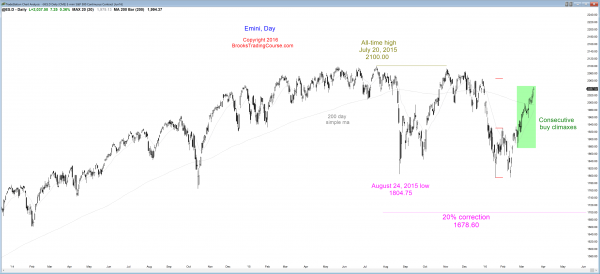
The daily S&P500 Emini futures candlestick chart is rallying strongly in a series of consecutive buy climaxes.
Over the past 2 months the daily S&P500 Emini futures candlestick chart has had a series of top attempts that were followed by strong bull breakouts. Every breakout is a buy climax, and when a market has 3 or more without much of a pullback, the odds are that it will soon have a TBTL Ten Bar, Two Legs, sideways to down correction. That will probably begin early next week. Because the bull channel has been so tight, the odds are that the correction will probably not fall far until after at least 5 or more bars. If it does form a tight trading range and there are strong bear bars in the range, those bear bars might provide enough selling pressure for the bears to get a deeper pullback over the next month. However, the bulls have been so willing to buy far above an average price (the moving average) that many will quickly buy any time the price gets close to the average price.
Even if the bears are able to turn the Emini down for ten or more bars, like it did after the October rally, the odds are that the bear reversal will be minor. This means that it would probably be a bear leg that was then followed by a trading range. This happened in early November.
It is always possible for the current rally to continue up to a new all-time high with no more than a 2 – 3 day pullback. However, that would be extremely unusual. A pullback over the next couple of weeks, which might grow into a trading range lasting a month or more, is more likely.
March/April is the strongest consecutive pair of months of the year. The last 2 weeks of March are usually up, in part because it is the end of the quarter and funds buy strong stocks so that their portfolios look good in the quarterly reports (window dressing). Calendar tendencies like this, however, are never reliable enough to be the basis for a trade.
Because the rally has been so strong, the probability of a bull breakout of the 2 year range is getting close to 50%. There are still lower highs and lows, and the monthly chart had an exceptional buy climax. The odds of a bear breakout before a bull breakout are still more than 50%, although no longer 60%.
Traders can see the end of the day bar-by-bar price action report by signing up for free at BrooksPriceAction.com. I talk about the detailed Emini price action real-time throughout the day in the BrooksPriceAction.com trading room, and a 2 day free trial is available.
When I mention time, it is USA Pacific Standard Time (the Emini day session opens at 6:30 am PST, and closes at 1:15 pm PST). You can read background information on the intraday market reports on the Intraday Market Update page.


