Monthly S&P500 Emini futures candlestick chart: Breakout will be soon
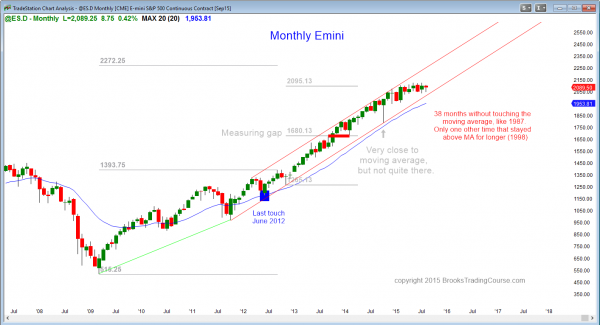
The monthly S&P500 Emini futures candlestick chart remains in its 7 month tight trading range.
The monthly S&P500 Emini futures candlestick chart will probably breakout within the next few months. It has an 80% chance of a bear breakout and a test of the monthly moving average, but it might have a bull breakout first. If it has a bull breakout, the breakout will probably reverse down before the end of the year.
The monthly Emini chart has not touched the 20 month moving average in 38 months. The monthly cash index has only held above its moving average for more than 38 months once in the past 50 years. That was for 44 months and it got back to the moving average in the 44th month.
Since that was at the start of an extremely strong bull trend, the current rally will probably pull back to the moving average in less time. If the current rally lasts 44 months, that would be February. Since I think the probability is very high (maybe 80%) that the current rally is not as strong, I believe that the current rally should hit the moving average before February, which means probably this year. While black swans do exist, they are rare, and the current rally is already a black swan. Will it be a black swan with 3 legs? I doubt it, but rare things do happen (but only rarely!).
Weekly S&P500 Emini futures candlestick chart: Tight trading range with no sign of a breakout
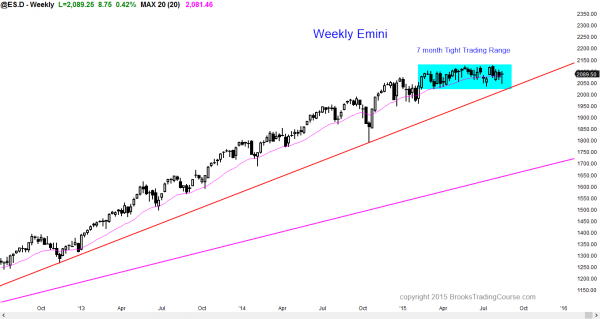
The weekly S&P500 Emini futures candlestick chart is in a 7 month tight trading range and there is no sign of an impending breakout, although one will probably come soon.
The weekly S&P500 Emini futures candlestick chart is showing no evidence of the direction of the breakout. Since the monthly chart is so extremely overbought, a bull breakout will probably fail. How long can a breakout continue before it fails? Most breakouts that fail do so within about 5 bars, which is about 5 weeks on the weekly chart.
If there is a bull breakout, the price action trading strategy that traders who trade for a living will use is to watch for a reversal. Since the reversal would be from a breakout of a tight trading range late in a bull trend, this would be a final flag top. The downside objective would be TBTL (Ten Bars, Two Legs) sideways to down. However, the 10 bars are on the highest time frame that shows the pattern. That is the monthly chart. This means traders will look for a correction sideways to down that will last about a year, and there is a 50% chance that it will get down to the October low. This would be a bull flag on the monthly chart, but a bear trend on the daily chart.
Daily S&P500 Emini futures candlestick chart: Learn how to trade futures when there is a wedge bull flag
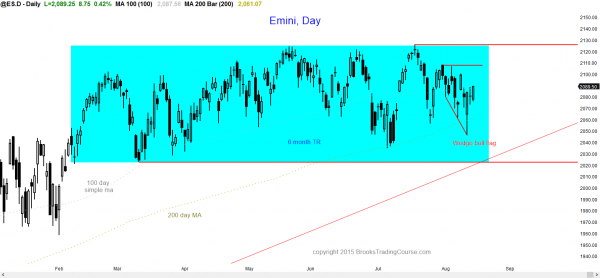
The daily S&P500 Emini futures candlestick chart sold off to its 200 day moving average in a wedge bull flag, and then reversed up strongly. It will probably test the top of the wedge channel, which is the July 31 lower high.
The daily S&P500 Emini futures candlestick chart reversed up strongly from a wedge bull flag and higher low (above the July low). That wedge is a channel from the spike down in late July, which means that the entire selloff from the all-time high was a spike and channel bear trend.
However, it ended at the 200 day moving average and above the July higher low. The odds are that the reversal up will have 2 legs and last about 10 or more bars, which is 2 weeks. It should test the July 31 high, which is the top of the wedge bear channel.
The bears will try to form a double top lower high major trend reversal. The bulls want a breakout above that major lower high and then a test of the all-time high. Because this pattern is so clear, the rally might get to that lower high of 2108.50 quickly. When enough institutions believe that a market will test a magnet, the market often gets vacuumed up there pretty quickly. Then the market decides between the bull breakout and the double top reversal down.
When everyone believes resistance will be tested, bears stop selling. Why sell here when they know that the market will soon be higher, which would allow them to sell at a better price? The bulls buy, even though they prefer to buy lower, because they believe the Emini will go higher before it goes lower. With bulls buying and bears only selling higher, the rally can be fast.
Once it reaches the target, it stalls or reverses because the bears suddenly and aggressively sell, and the bulls sell to take profits. No one knows if the bears will sell for a swing trade or a scalp. If they swing trade and if the bulls do not buy back their longs on the reversal down, the double top can be the start of the monthly correction. If the bears only scalp and the bulls quickly buy back their longs after a small pullback, the pause at resistance will be brief. The Emini will break above the resistance and go to the next resistance, which is the all-time high.
Traders can see the end of the day bar-by-bar price action report by signing up for free at BrooksPriceAction.com. I talk about the detailed Emini price action real-time throughout the day in the BrooksPriceAction.com trading room, and a 2 day free trial is available.
When I mention time, it is USA Pacific Standard Time (the Emini day session opens at 6:30 am PST, and closes at 1:15 pm PST). You can read background information on the intraday market reports on the Intraday Market Update page.


If I may, it’s because January 2013 is a measuring gap, and a nice looking one at that!
Sept ’12 was a swing high, Jan ’13 a BO above it then look how Feb ’13 pulled back to the BO point, but then found buyers above it! It couldn’t even get back to 1393.75 before rallying. Classic breakout test signalling resumption of bull and confirming Jan ’13 as a measuring gap.
Hi Al,
Concerning the first graph: between the June 2012 ‘last touch’ and the 1265.13 bottom-of-channel touch, you note the (potential) 1393.75 measuring gap midpoint of a possible final high of 2272.25.
Can you elaborate as to why you might think this is the midpoint if this scenario plays out?
Thanks,
David Saunders
Canberra, Australia
It is not that I think that it will get there without first pulling back. I think that it will not until after one or more pullbacks. However, I am always looking for measured move projections because the institutional computers use them as magnets. In 2012, the market tried to reverse down from a wedge top and a double top (2007 was the 1st top), but then had a strong bull breakout. That type of breakout often creates a measured move magnet that draws the market to it.