Monthly S&P500 Emini futures candlestick chart: Strong bull trend, but buy climax
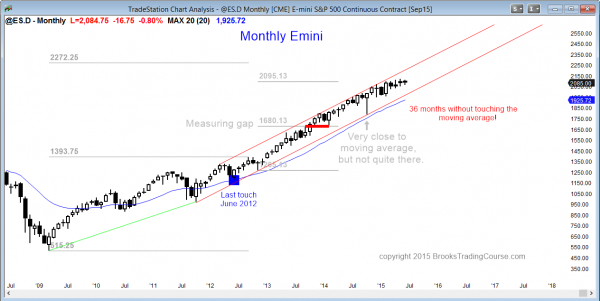
The monthly S&P500 Emini futures candlestick chart is in a small pullback bull trend with no sign of a top, but since this is 36 months without touching the moving average and that is historically unusual, a reversal down to below the moving average will probably come within the next few months.
The monthly S&P500 Emini futures candlestick chart has been above its 20 month exponential moving average for 36 months, which is extremely unusual. There is an 80% chance that it will hit the moving average this year. Since the average is about 10% below the high, this means that he Emini will almost certainly have at least a 10% correction this year. Traders learning how to trade the markets should be very careful because a sharp reversal can come at any time.
The FOMC meeting on this coming Wednesday could be a catalyst to a big move up or down. Also, if the Supreme Court rules that parts of Obamacare are unconstitutional this month, there could be a perception that the US has weak leadership, and this could be the start of the pullback. Since the Emini monthly chart is still in a strong bull trend, there is a 50% chance of at least one more push up before the reversal down.
Weekly S&P500 Emini futures candlestick chart: Learn how to trade the markets in breakout mode
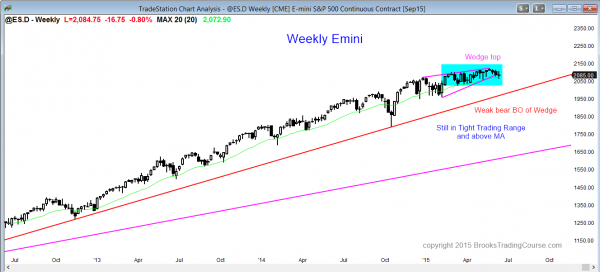
The weekly S&P500 Emini futures candlestick chart is breaking below a wedge top, but this bear breakout is as weak as last month’s bull breakout above the 3 month trading range. The dominant feature is the 4 month tight trading range, and the chart is in breakout mode.
The weekly S&P500 Emini futures candlestick chart has been in a very tight trading range for 4 months. There is a 50% chance of a breakout up or down, and a 50% chance that either breakout will fail and reverse. The odds are 80% that there will either be a bear breakout or a bull breakout that fails and reverses down. There is only about a 20% chance of a successful strong bull breakout because the monthly chart is so overbought.
Daily S&P500 Emini futures candlestick chart: Minor reversals in tight trading range
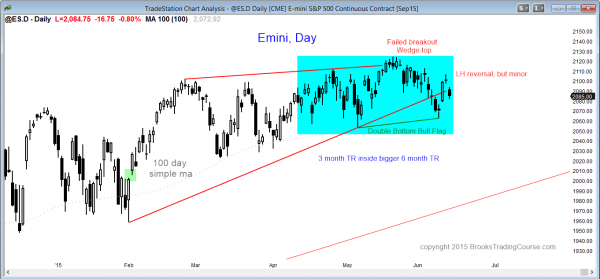
The daily S&P500 Emini futures candlestick chart is is in a tight trading range and continues to have minor reversals up and down, each lasting 5 – 10 bars.
The daily S&P500 Emini futures candlestick chart is in the middle of a 4 month trading range and has a 50% chance of a bull or bear breakout. As with all trading ranges, there are always reasonable buy and sell setups. The bears see a developing head and shoulders top and the bulls see a double bottom bull flag. All reversals within trading ranges should be assumed to be minor, since 80% of breakout attempts fail. However, this tight trading range has gone on for about 100 bars, which is a long time, and it is within a larger trading range. The breakout is likely to come soon. I don’t know if that means 10 bars (days) or 50 bars, but this is becoming unusually long and that increases the chances that the breakout will be soon.
Best Forex trading strategies
The 240 minute EURUSD chart is in a triangle at the top of a 6 month trading range. It might have a breakout up or down on this week’s FOMC report. Since the bear trend last year was so strong, a bull breakout will probably fail and reverse down. The weekly chart is on a 20 gap bar sell signal, and the odds favor a test of the bear low before any rally can go very far up.
The weekly USDJPY chart has a possible Final Flag top. However, after 3 strong weeks up, the bears might need a 2nd entry sell signal before the market works back down into the tight trading range.
Traders can see the end of the day bar-by-bar price action report by signing up for free at BrooksPriceAction.com. I talk about the detailed Emini price action real-time throughout the day in the BrooksPriceAction.com trading room, and a 2 day free trial is available.
When I mention time, it is USA Pacific Standard Time (the Emini day session opens at 6:30 am PST, and closes at 1:15 pm PST). You can read background information on the intraday market reports on the Intraday Market Update page.


