Monthly S&P500 Emini futures candlestick chart: Opportunity to learn how to trade a top
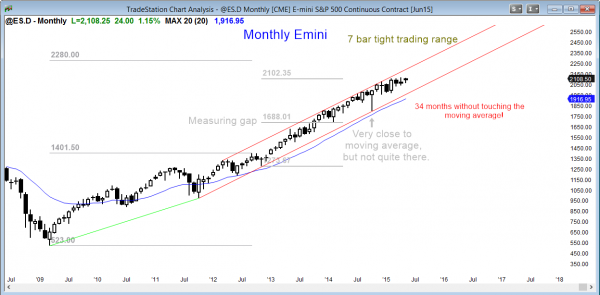
The monthly S&P500 Emini futures candlestick chart has been in a tight trading range for for 7 months.
The monthly S&P500 Emini futures candlestick chart is in a 7 month tight trading range and it has not touched the moving average in 34 months, which is exceptional. Fast Money yesterday finally had a technician on the show who made that point. He used the 200 day moving average as his measure of how extremely overbought the Emini is. He also used the 1987 crash as an example of a time when the market was above the moving average for a comparably long time. He correctly did not say that the current market is in any other way like that crash, but he did say that he expects a 10% correction.
Since the Emini has an 80% chance of getting back to the moving average this year and it is more than 10% below today’s close, I think that 10% is the minimum objective and that it might also test below the October low.
Weekly S&P500 Emini futures candlestick chart: Breakout mode
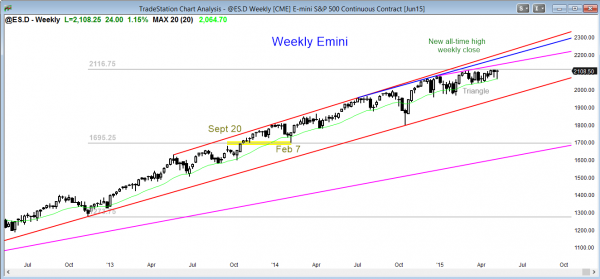
The weekly S&P500 Emini futures candlestick chart closed the week with a doji candlestick pattern within a 3 month tight trading range.
The weekly S&P500 Emini futures candlestick chart continues in its 13 week tight trading range. It is in https://www.brookstradingcourse.com/how-to-trade-manual/trading-ranges/#breakout-mode. Since this tight trading range is occurring late in a bull trend, a bull breakout will probably be followed by a final flag reversal.
Daily S&P500 Emini futures candlestick chart: Testing the top of the trading range
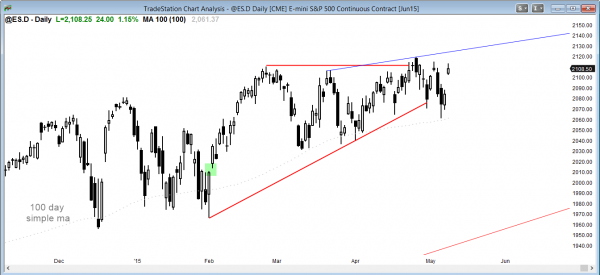
The daily S&P500 Emini futures candlestick chart is gapped up today, but it is still within the trading range.
The daily S&P500 Emini futures candlestick chart gapped up again today, but it is still below the all-time high. Bears are shorting this rally with a tight stop above the all-time high, betting that the Emini will begin to form a series of lower highs and then have s strong bear breakout. Whenever a stop is tight, the probability of success has to be low because there has to be a reason for an institution to take the other side of the trade. If the bears get great risk:reward, the bulls get higher probability. The candlestick pattern is an ascending triangle, and the probability is that it will have a bull breakout. However, a triangle forming late in a bull trend usually becomes the final bull flag before a correction.
Best Forex trading strategies
The dollar is oversold on the daily chart and has formed a wedge bull flag over the past month. For those trading Forex for a living, look for a bounce in the dollar over the next couple of weeks. The dollar rally was so climactic that this trend resumption, should it occur, will probably be within a developing trading range on the daily chart. This means that sideways for at least another month is likely.
The EURUSD rally has been strong on the daily chart, but the EURUSD began to turn down yesterday after a new high in a month long bull micro channel. Traders learning how to trade Forex markets should expect t trading range or pullback lasting at least a week. The rally was strong enough so that Forex price action traders expect that any selloff will form a higher low, and then a 2nd leg up. Less likely, this rally is forming a double top with the February high, and the selloff will fall below the neckline (March low) for a measured move down.
Traders can see the end of the day bar-by-bar price action report by signing up for free at BrooksPriceAction.com. I talk about the detailed Emini price action real-time throughout the day in the BrooksPriceAction.com trading room, and a 2 day free trial is available.
When I mention time, it is USA Pacific Standard Time (the Emini day session opens at 6:30 am PST, and closes at 1:15 pm PST). You can read background information on the intraday market reports on the Intraday Market Update page.


Thanks for the EURUSD update Al! Targets above? You mentioned the Feb H, I’m assuming you mean the Feb 3rd H at 1.1540? How about the MM target based on the last bear leg, from the 6th April H to the 13th April O, at 1.1500?
I had the 29th April bar as a MG, and was expecting this rally to reach 1.1416 before PB, based on MM 22nd April O to the 28th April H. But it fell quite far short before the May 7th start of the bear leg. I find that the EUR responds like clockwork intraday to MMs calculated in this way, but often on the higher time frame charts I struggle to find the prices the computers are using. Any nuggets of wisdom we can gleam from you there please?
A logical test area is the February final flag on the daily chart, and maybe the measured move target from the double bottom, which is a little higher. I am writing on May 14, and it is at the top of its 2 week trading range. The 60 min chart is in a wedge. The odds are that it will pullback before testing higher. There is a small chance that this is a bull trend. It is more likely that it is a bull leg in a 4 month TR.
What happens if the market stays sideways to up so the monthly MA is pulled up and touches the Oct low. Are you still going to look for a 10-20% correction? Would your premise change?
I mentioned that in one of the earlier blogs as a possibility. If it were to happen, then there would be a very long tight trading range occurring in a tight bull channel that has lasted well over 100 bars. I think the odds are about 70% that a bull breakout would fail and lead to a 2 legged correction lasting at least 10 bars (months). This would almost certainly reach at least 10%. Picking tops is a low probability thing to do. However, the odds of much more up when the market is this overbought are very small. Whether the correction occurs from the current pattern or has one more brief leg up is impossible to know. What I do know is that when a tight channel lasts a long time, it has about a 70% chance of 10 bars and 2 legs down once a correction begins. I also know that 34 months above the moving average is extremely unusual and therefore climactic, and climaxes usually correct for more bars and points than what seems likely while the trend is still continuing.