Monthly S&P500 Emini candle chart: Strong bull trend, but overbought
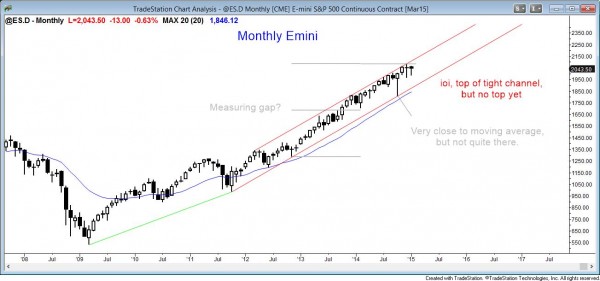
The monthly Emini candle chart is in a strong bull trend, but it is very overbought.
The monthly S&P500 Emini candle chart is in a strong bull trend, but it is very overbought and probably will have a 20% correction at some point this year. There is one week left to the month and the chart currently has an inside bar following last month’s outside bar. This forms an ioi (inside-outside-inside) breakout mode setup.
Weekly S&P500 Emini candle chart: Trading range
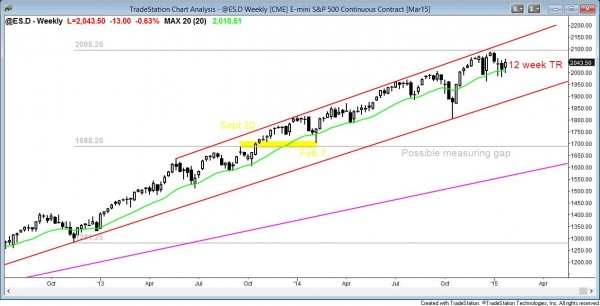
The weekly Emini candle chart is in a bull trend, but has been in a trading range just above the moving average for the past 12 weeks.
The weekly S&P500 Emini candle chart has been sideways for 12 weeks, just above the moving average. This week was the entry bar for a high 2 (ABC bull flag) buy setup. Last week formed the signal bar, but it had a bear body and was therefore weak. This week was the entry bar for the long. Although this week had a bull body, which is a sign of strong bulls, the close fell below last week’s high during the final hour of the week. The bulls were unable to generate another important sign of strength. This means that the 3 month trading range is still fairly neutral, even though it is holding above the moving average.
If the bulls get their breakout, it probably will not go very far. When there is a bull breakout of a high 2 bull flag late in a bull trend, the flag often becomes the final flag of the trend. This means that the breakout often fails and is followed by at least a two-legged correction. Since the weekly candle chart is also at the top of the bull channel, the chance of a reversal down after a bull breakout is even greater. The Emini is still in a bull trend on the weekly chart, but as more bars get added to the tight trading range, the edge that the bulls have melts away. After 20 bars or so, the trading range becomes completely neutral and the probability of a bear breakout becomes equal to that of a bull breakout.
Daily S&P500 Emini candle chart: Double bottom and double top within a tight trading range
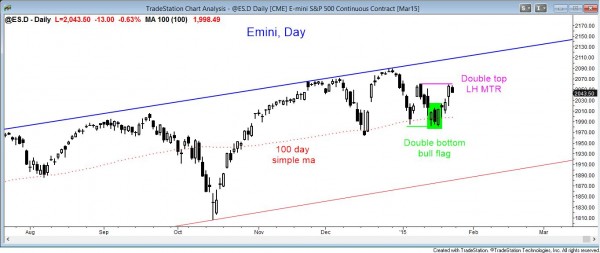
The daily Emini candle chart bounced from a double bottom bull flag early this week, and today it turned down from a double top bear flag. It is in breakout mode for a measured move up or down.
The daily S&P500 Emini candle chart turned down today and formed a double top with the high of 2 weeks ago. Last week, it turned up from a double bottom. Tight trading ranges often contain double tops and bottoms. The daily chart is in breakout mode. There is an equal chance of a bull or bear breakout, and a 50% chance that the breakout will fail and lead to a breakout in the opposite direction. Ultimately, there will probably soon be a breakout that leads to at least a measured move up or down.
The bears see the tight trading range as a double top lower high major trend reversal. The bulls see it as a double bottom bull flag at the moving average. Both are correct, but neither has a breakout yet. The Emini today pulled back into the tight trading range. It may test all of the way back to the bottom before trying for a bull breakout. Until there is a breakout, there is no breakout. Traders will continue to take quick profits, and buy low and sell high.
Traders can see the end of the day bar-by-bar price action report by signing up for free at BrooksPriceAction.com. I talk about the detailed Emini price action real-time throughout the day in the BrooksPriceAction.com trading room, and a 2 day free trial is available.
When I mention time, it is USA Pacific Standard Time (the Emini day session opens at 6:30 am PST, and closes at 1:15 pm PST). You can read background information on the intraday market reports on the Intraday Market Update page.


