Monthly S&P500 Emini candle chart: Overbought bull trend, forming more trading range price action
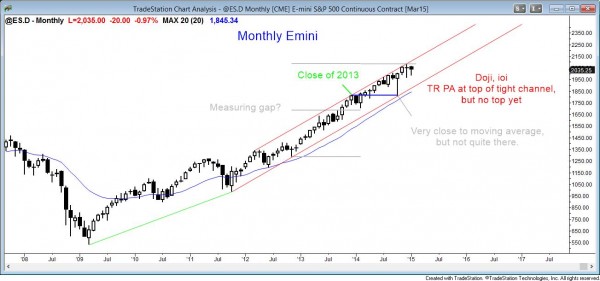
The monthly candle chart is in an early tight trading range. This month so far is an inside doji candle and it follows last months outside doji candle.
The monthly S&P500 Emini candle chart is in a strong bull trend, but it is extremely overbought. The current candle is an inside bar and last month was an outside bar. This creates an ioi (inside-outside-inside) pattern, which is a breakout mode setup. The bar is a signal bar for both directions. The bulls want a bull breakout and the bears want a selloff. However, the month is early and the bar will change by the time it closes.
The key point is that the monthly chart is in a strong bull trend, but extremely overbought. This means that it will probably have a 20% correction at any point this year. Although that correction may have already begun because this month is below the all-time high of last month, there is no significant evidence of that yet on this chart.
Weekly S&P500 Emini candle chart: Bull trend, but in 10 week tight trading range
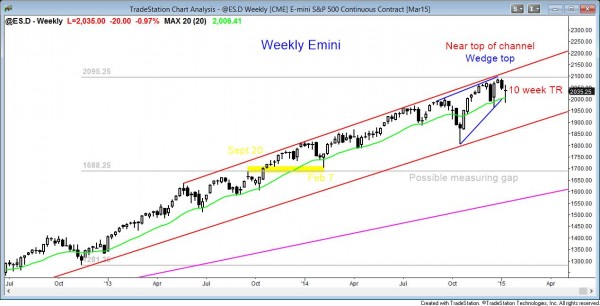
The weekly Emini candle reversed up strongly off the moving average, but had a doji close. This is trading range price action and it is forming in the middle of a 10 week trading range.
The weekly S&P500 Emini candle chart reversed up again from the moving average. However, this reversal bar is only a doji and is therefore less bullish than the reversal up from 3 weeks ago. The chart has been in a trading range for 10 weeks. It is also in a bull trend, and until there is a strong bear breakout with follow-through, traders will only scalp shorts and will continue to swing trade longs. Because the weekly chart is overbought and at the top of the bull trend channel, traders are ready for a bear breakout, even though there is no evidence for one yet.
Daily S&P500 Emini candle chart: Bull trend evolving into a trading range
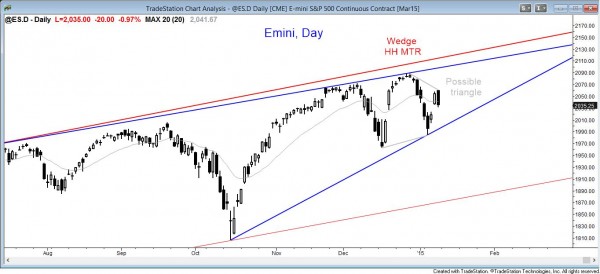
The daily Emini chart is in the middle of a 3 month trading range. It reversed down today. It is forming a lower high major trend reversal or a triangle and it is in breakout mode.
The daily S&P500 Emini candle chart is a bull trend evolving into a trading range. It has been in a broad bull channel since September, or even April for those with a loose definition. It also has been in a trading range for 3 months.
The trading is much more two-sided than that on the weekly and monthly charts. This means there is a higher probability of a bear trend developing on this chart. If the Emini sold off for 200 points, this would be a bear trend on the daily chart, but only a pullback on the monthly chart.
The Emini turned down from a higher high major trend reversal two weeks ago. Today’s bear reversal might be a lower high major trend reversal, but this is unlikely because the rally lasted only two days. This makes a minor reversal and then more of a trading range trading more likely. If it sells off a little and then bounces, it will also be in a triangle, which has no more significance that any trading range. As more bars get added to the range, the probability of a bear breakout becomes equal to that of a bull breakout. As long as it is in a bull trend, bull trend resumption is still slightly more likely than bear trend reversal (a reversal down into a bear trend).
As long as the Emini continues to form higher highs and lows, the broad bull channel is intact. However, once it falls below a higher low, like the December 16 low, more computers will begin to see this as no longer a bull trend. Instead, they will see it as either a trading range or an early bear trend. This will change how they trade. They will begin to scalp longs instead of swing trading them, and they will be increasingly willing to swing trade shorts. Also, they will sell aggressively on rallies that reach the upper half of the prion bear leg, expecting lower highs and then lower lows.
Traders can see the end of the day bar-by-bar price action report by signing up for free at BrooksPriceAction.com. I talk about the detailed Emini price action real-time throughout the day in the BrooksPriceAction.com trading room, and a 2 day free trial is available.
When I mention time, it is USA Pacific Standard Time (the Emini day session opens at 6:30 am PST, and closes at 1:15 pm PST). You can read background information on the intraday market reports on the Intraday Market Update page.


