Monthly S&P500 Emini futures candlestick chart: Small breakout of 6 month tight trading range
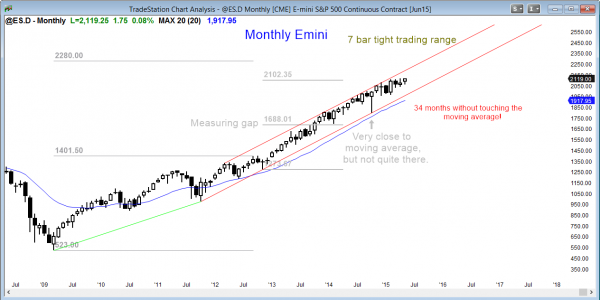
The monthly S&P500 Emini futures candlestick chart is breaking above a 6 month trading range.
The monthly S&P500 Emini futures candlestick chart has been above its moving average for 34 months and there is an 80% chance that it will touch the moving average this year, in my opinion. However, there is no sign of a top and the small pullback bull trend is continuing upward.
Weekly S&P500 Emini futures candlestick chart: Tight trading range becoming bull channel
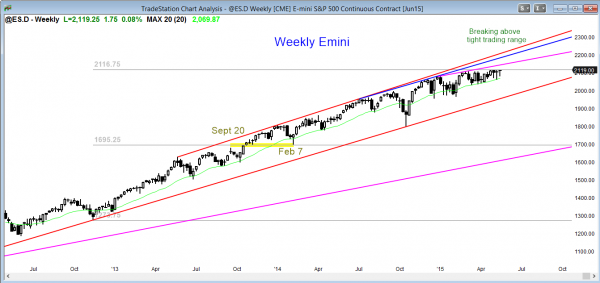
The weekly S&P500 Emini futures candlestick chart has been in a tight trading range, but now is bending up in a bull channel above the moving average.
The weekly S&P500 Emini futures candlestick chart is the most interesting higher time frame. The Emini has been in a tight trading range for about 15 bars. This week had a small breakout and closed at the high of the week. This creates the possibility that the Emini might gap up on Monday and form a gap up on the weekly chart. The bulls would want this to be a measuring gap for a rally equal to the height of the tight trading range. This is about 80 points, and it is near bull trend channel lines, creating a couple of magnets just below 2200.
Most tight trading ranges that occur late in bull trends like this become the final bull flag. The breakout might last for 5 or more bars (weeks), and it might even test the top of the bull trend channel. However, the odds are that the breakout will ultimately fail and the Emini will reverse back into the tight trading range. Since the monthly chart is so overbought and the monthly moving average is around 1900, the reversal on the weekly chart will probably gal to that level.
Because the Emini is breaking above a 15 bar tight trading range, it might rally strongly for several bars (weeks), and the intraday trading ranges of the past few months might be replaced by protracted swings. The day trading tip for beginners is to be ready for a possible change in behavior on the 5 minute chart. The price action trading strategy might soon switch from a lot of scalping to swing trading.
Just because the odds of the bull breakout are more than 50% does not mean that it will be successful. There is a reasonable chance that either there will not be a breakout or that there will be a breakout, but it will fail. In either situation, traders learning how to trade the markets have to be ready to take bear swing trades if the Emini reverses down next week.
Daily S&P500 Emini futures candlestick chart: How to trade futures at a new high
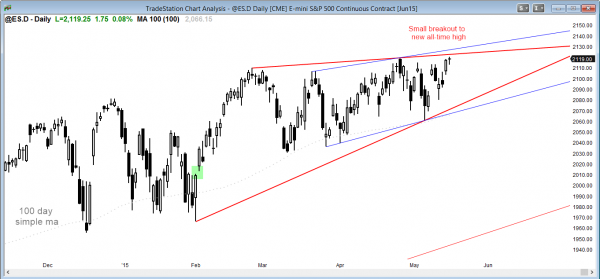
The daily S&P500 Emini futures candlestick chart has been in an ascending triangle for 4 months, and had a small breakout above the top today.
The daily S&P500 Emini futures candlestick chart is in a broad bull channel for 6 – 12 months, depending on where you want to choose for the start. The Emini daily chart is also in an ascending triangle that began in February, and today broke to another small all-time high. Since the Emini is in a broad channel, bears will look to sell a breakout to a new high for a trade down. Bulls will buy pullbacks.
Best Forex trading strategies
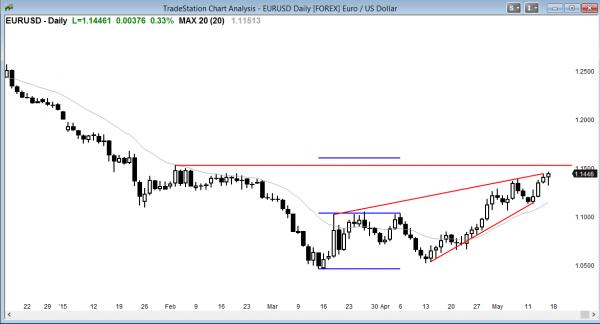
The EURUSD daily chart is rallying to the 1.1500 area, which is the top of the February triangle and a measured move up from the double bottom. It is also forming a wedge bear flag.
The EURUSD has been rallying for a couple of months, but the rally is probably a bull leg in what will become a trading range. Although it is forming a wedge bear flag, there is no sign of a top yet. Since the rally is following an extreme sell climax, it might continue well above this resistance area to test the 1.2000 breakout point below the 10 year trading range.
Traders can see the end of the day bar-by-bar price action report by signing up for free at BrooksPriceAction.com. I talk about the detailed Emini price action real-time throughout the day in the BrooksPriceAction.com trading room, and a 2 day free trial is available.
When I mention time, it is USA Pacific Standard Time (the Emini day session opens at 6:30 am PST, and closes at 1:15 pm PST). You can read background information on the intraday market reports on the Intraday Market Update page.


