Monthly S&P500 Emini candle chart: Extreme buy climax, but no sign of a top
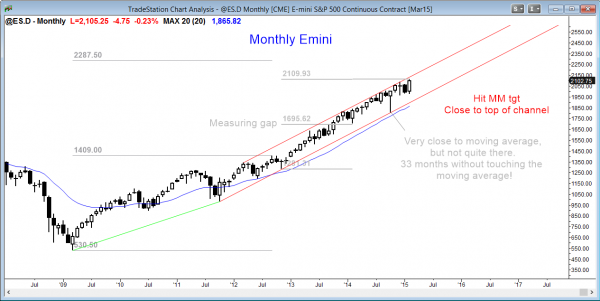
The monthly Emini candle chart had an outside up month, but it has not touched the moving average in 33 months. This is extreme behavior and will probably lead to a 20% correction this year.
The monthly S&P500 Emini candle chart formed an outside up (its low was below the January low and its high and close were above the January high) big bull candle this month. This is the 33rd consecutive month above the moving average. Nothing has changed. The bull trend is still very strong, but extremely overbought. There is no sign of a top yet, but the chance of significantly higher prices from here without a 20% correction is small.
The two prior times in the past 50 years when the S&P500 cash index went this many bars without touching the moving average continued higher. The 1987 rally lasted 38 months, but was followed by a 36% crash. The 1998 rally after the Republicans took over congress lasted 44 months and then corrected 22%.
Although a small pullback bull channel usually has to go sideways for 5 or more bars to create selling pressure before a pullback begins, that is not always the case. A sharp selloff can quickly accelerate as recent buyers find themselves holding losing positions in an overbought market. As they exit with a loss, their selling will make bulls who bought earlier want to sell. This can lead to a very big, brief selloff without a clear top. When this happens, there is usually some news event at the same time, but the correction is going to take place with or without an obvious news event, and any news event will probably be simply the excuse for bulls to exit in a panic, which is always their plan when they buy late in a buy climax. These are momentum buyers…they buy when there is strong momentum up. They are hoping for a profit before the profit taking begins, but because they understand how overbought the Emini is, they will be very quick to exit.
Weekly S&P500 Emini candle chart: Losing momentum at a new high
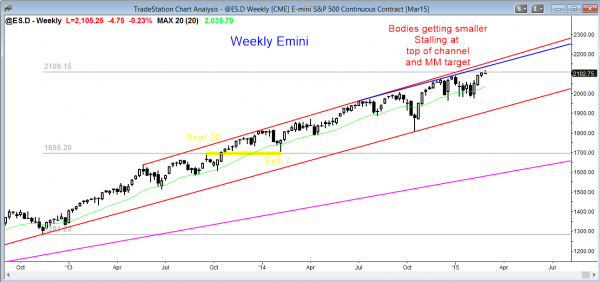
The weekly Emini candle chart has been losing momentum in this breakout above the tight trading range. The bodies are getting smaller, and this week was a doji reversal bar and a sell signal bar. The market might pull back after going above the measured move target.
The weekly S&P500 Emini candle chart is in a tight bull channel, but the tight trading range in December and January might become the final bull flag before a bigger correction takes place. The bodies of the bull bars for the past 4 weeks have been shrinking. This is a sign that bulls are becoming less interested in buying at these prices.
Although this week was a doji bar, it closed below its midpoint and it is therefore a reversal bar and a sell signal bar for bears betting that the breakout will fail. Since it is following 3 strong bull bars, the odds are that there will be buyers below last week’s low and that the bears will lose. With the weekly chart as overbought as it is and with it hitting the measured move target from the February 7, 2014 measuring gap, there might be enough profit taking for a test back into the January tight trading range.
The bulls will buy below this week’s low, betting that the reversal attempt will fail and become a breakout pullback buy setup. However, for over a year, bears have been able to make money by selling reversals down from new highs and they will probably be able to do that again. Bears are becoming more willing to sell new highs, and bulls will probably become quicker to take profits. Both believe that the tight channel will begin to evolve into a trading range soon.
Daily S&P500 Emini candle chart: Buy climax and wedge top
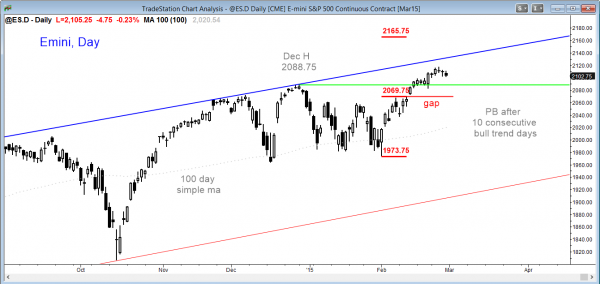
The daily Emini candle chart is having a pullback after a buy climax and a small wedge top.
The daily S&P500 Emini candle chart is in a tight trading range after a buy climax, which was 10 consecutive bull trend bars. The pullback should last at least another week or two. At that point, the bulls will try to resume the trend up, but the bears will try for a strong bear breakout that could lead to the 20% correction that should come this year.
Unlike the weekly chart, which is in a tight bull channel, the daily chart is more two-sided and it has been in a broad bull channel. A broad bull channel usually soon transitions into a trading range. The bottom of the range is the October low, and selloffs in trading ranges usually fall below support. There will probably be a pullback this year to below that October low around 1800.
Traders can see the end of the day bar-by-bar price action report by signing up for free at BrooksPriceAction.com. I talk about the detailed Emini price action real-time throughout the day in the BrooksPriceAction.com trading room, and a 2 day free trial is available.
When I mention time, it is USA Pacific Standard Time (the Emini day session opens at 6:30 am PST, and closes at 1:15 pm PST). You can read background information on the intraday market reports on the Intraday Market Update page.


