Monthly S&P500 Emini candle chart: Bull breakout and trend resumption
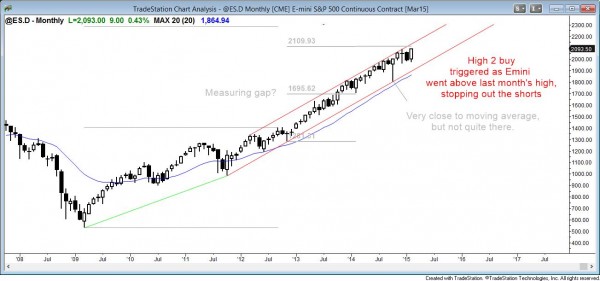
The monthly Emini candle chart broke out to a new all-time high, but it is at the top of the channel and it is overbought.
The monthly S&P500 Emini candle chart had a bull breakout and trend resumption. It broke below an ioi sell signal early in the month and reversed up to an outside up month. Although the month has a long way to go before it closes, the bar is currently bullish. As overbought as the monthly chart is, there is still no sign of a top. There is a measured move target around 2109 and the top of the bull trend channel is just above that.
Weekly S&P500 Emini candle chart: Breakout of a bull flag
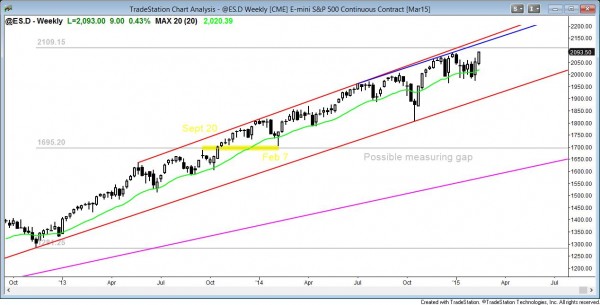
The weekly Emini candle chart broke above a tight trading range to a new all-time high. There is a measured move target around 2109 based on the gap between the September 20 high and the February 7 low, using the November 2012 low as the start of the move. If more computers chose the June 2012 low as the start, the target is higher. The top of the bull channel is just above 2140.
Since the monthly chart is so overbought, a 20% reversal can come at any time. There is no sign of a top at the moment. If there is a strong reversal down in the absence of a credible top, that can be enough to make traders believe that the correction has begun.
The weekly S&P500 Emini candle chart broke strongly above a tight trading range. When a tight trading range occurs late in trend, it often becomes the final flag before a reversal comes. The minimum objective for any reversal is ten bars and two legs (TBTL). There are now two consecutive bull trend bars and this makes it likely that the Emini will go higher.
Daily S&P500 Emini candle chart: Breakout above a month long trading range
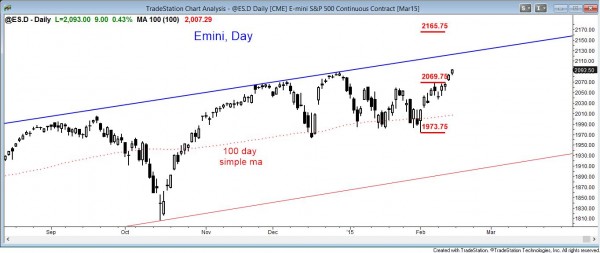
The daily Emini candle chart is broke to a new all-time high. The breakout is strong enough so that the first pullback will probably be bought.
The daily S&P500 Emini candle chart failed to create a micro double top, which is did at the two prior trading range tops. Instead, it broke strongly to the upside. This means that there are trapped bears who will look to buy back their shorts with a loss on the first pullback. When bears are buying, then no one is selling, and the odds of a 2nd leg up are high.
The daily chart has been in a broad bull channel for more than a year and bears have been able to short above prior highs, scale in higher, and use wide stops to trade profitably. This is a sign that the bull channel is trying to evolve into a trading range. Less likely, it can breakout strongly and the trend can again become a strong bull trend. This is especially unlikely because the monthly chart is so overbought. Over the next week or two, the odds favor higher prices since the first pullback will probably be bought by both bulls and bears.
The next target is the top of the channel, which is around 2125. The bears will try to create a reversal there, which would be a higher high major trend reversal. However, if the bulls are success in creating the top, there is only a 40% chance of a swing down. A swing on the daily chart is at least ten bars and two legs.
Traders can see the end of the day bar-by-bar price action report by signing up for free at BrooksPriceAction.com. I talk about the detailed Emini price action real-time throughout the day in the BrooksPriceAction.com trading room, and a 2 day free trial is available.
When I mention time, it is USA Pacific Standard Time (the Emini day session opens at 6:30 am PST, and closes at 1:15 pm PST). You can read background information on the intraday market reports on the Intraday Market Update page.


