Monthly S&P500 Emini candle chart: Strong bull trend and no sign of a top
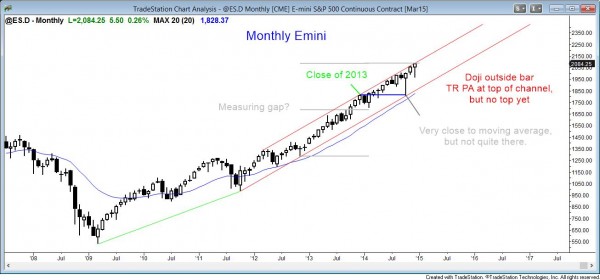
The monthly Emini candle chart is in a strong bull trend, but it is testing the top of a bull trend channel.
The monthly S&P500 Emini chart is in a strong bull trend, but it is overbought and at the top of the bull trend channel. However, a trend can get much more overbought before the bears finally stop losing money. There is no sign of a top yet on the monthly chart. At a minimum, swing traders need a protective stop below the December low of 1963. This is because December was an outside up month and therefore a breakout of last month’s high. Many instead will use a stop below the October low of 1806, but most of those traders would exit before that stop got hit.
This coming Wednesday is the final day of the month so traders will look at monthly support and resistance as magnets this week, especially in the final hours of the month. Last month’s high of 2066.25 is the nearest magnet. The bulls want December to close above November’s high as a sign of strength, and the bears always want the opposite. The bulls want a close above the November close of 2059.25 so that December will be another up month. The bulls also want a close above this month’s open of 2051.25 so that the candle will have a bull body.
Further monthly targets are too far to have much chance of being hit. Since Wednesday is also the last day of the year, the bears would love this year’s close to fall below last year’s close of 1811.75, but the probability of that is small.
Weekly S&P500 Emini candle chart: Top of tight bull channel
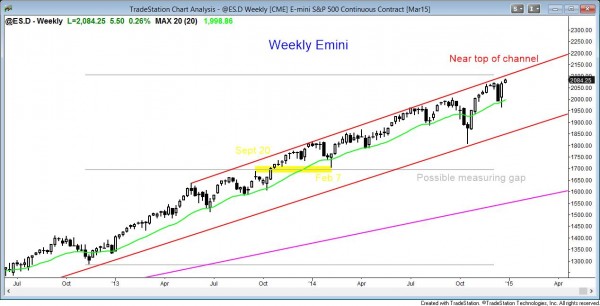
The weekly Emini candle chart is in a fairly tight bull trend channel. It is just below the bottom of the weekly bull trend channel line and a measured move target.
The weekly S&P500 Emini candle chart is near the top of the bull trend channel and a measured move target that is based on the November, 2012 low and the gap between September 20, 2013 and February 7, 2014. The measurement from the September 20, 2013 high projects to 2095.25. For traders using the middle of the gap, the target is a little higher.
Most weekly chart traders will take partial or full profits at a new high in the channel, and bear scalpers will short above the December 5 high for a test back down to that high. Bulls prefer to bull pullbacks when a chart is in a channel and then take profits at new highs.
The weekly chart has continued to go above trend channel lines, which is common, and traders have had to draw increasing steep, new trend lines. The current top of the channel is just below 2110. Almost all bear trend reversals begin at the top of a channel, but most tops fail. Bear swing traders will wait for either a strong signal bar and good context, or for a strong bear breakout before shorting.
Daily S&P500 Emini candle chart: breakout to a new all time high, but weak follow-through
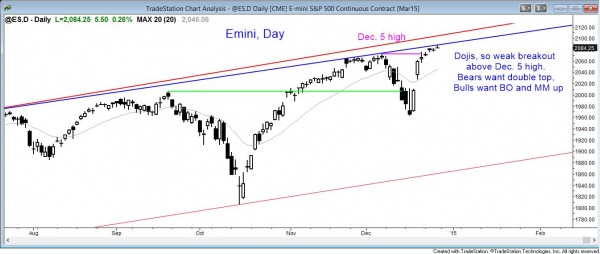
The daily Emini candle chart is at the top of a broad bull channel and is having a weak breakout above the December 5 high.
The daily S&P500 Emini candle chart is at the top of a broad bull channel and the breakout to a new all time high above the December 5 high has been week. This is a sign that bulls are taking profits at the new high and that fewer bulls are putting on new longs here. Also, bears are beginning to take shorts for brief trades down (scalps). The weekly trend channel top is above the daily channel top, and the Emini will probably have to break out above both before it turns down for a test of the bottom of the channel. However, a bull trend sometimes turns down before reaching the top of a channel.
Traders can see the end of the day bar-by-bar price action report by signing up for free at BrooksPriceAction.com. I talk about the detailed Emini price action real-time throughout the day in the BrooksPriceAction.com trading room, and a 2 day free trial is available.
When I mention time, it is USA Pacific Standard Time (the Emini day session opens at 6:30 am PST, and closes at 1:15 pm PST). You can read background information on the intraday market reports on the Intraday Market Update page.


