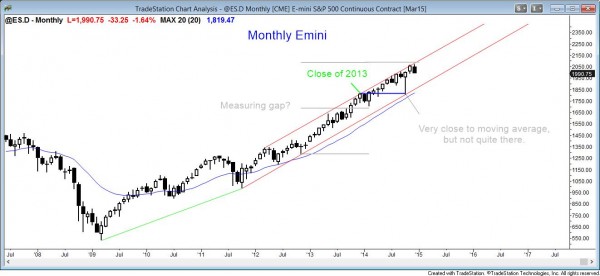
Monthly S&P500 Emini candle chart: Failed bull breakout on the monthly chart, and there is now a bear trend on the 60 minute chart
The bear candle on the monthly chart is close to totally reversing November’s rally.
Although this week’s selling was enough to create a bear trend on the 60 minute chart, the monthly chart is still in a bull trend. The bulls hope that this month’s selloff is simply a pullback from last month’s breakout, and that this month becomes a high 1 buy signal bar for next month’s bulls. The bears want this month to be a failed breakout and the start of a reversal.
Because the monthly chart is so overbought, it is not likely to go up much from here without a pullback. A pullback could last 10 or more bars, which would be a small trading range. However, the bear legs within that range could also be bear trends on the daily chart. The monthly bears probably will need at least 5 month’s of sideways trading before they can generate enough selling pressure to create a trend reversal. Much less likely, a huge selloff for one or two months could also create a bear tend.
The monthly candle chart is at the top of a channel that has lasted for 3 years. There is a 75% chance that it will test the bottom of the channel before it goes above the channel by 5 bars. However, 5 bars is 5 months, and this means that it could go much higher before it reverses to the bottom of the bull trend channel. The bull trend line is rising and it is currently around 1850. Any reversal will probably also hit the moving average, which is also rising and is currently around 1830.
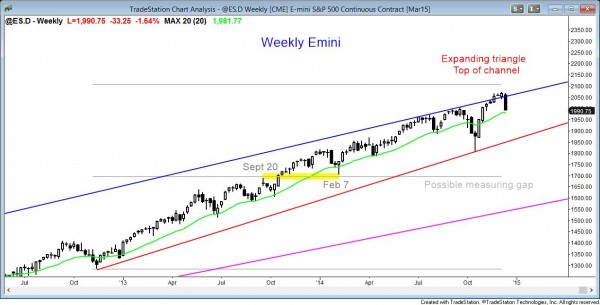
Weekly S&P500 Emini candle chart: Strong bear trend reversal attempt at the top of a bull channel
This week is a 2nd entry short for the failed breakout above the weekly bull trend channel and for the expanding triangle top.
This week’s S&P500 Emini candle is the entry bar for the bears, and it is a very strong bar. They need follow-through selling next week to increase the chances that the Emini will fall much further. Otherwise, the selloff will probably simply become a bear leg in a trading range. The weekly chart is still in a bull trend, but this week’s strong bear channel increases the chances that the bull trend will begin to evolve into a trading range, which is what usually happens in the market cycle.
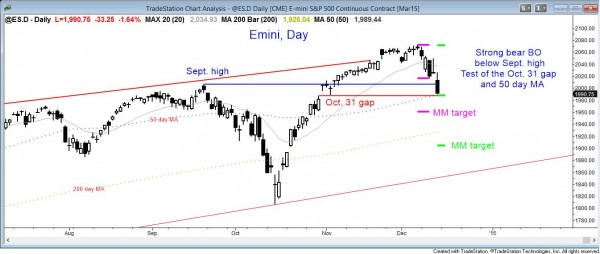
Daily S&P500 Emini candle chart: Strong bear breakout
The daily Emini candle chart reversed down strongly below the September high, and it is testing the 50 day moving average and the October 31 gap.
The daily S&P500 Emini chart is still in a bull trend, but the bear trend reversal is strong enough so that swing traders will look to sell a rally, hoping to create a major trend reversal. Today’s close was far below Wednesday’s low. This means that today’s candle could be a measuring gap, and the minimum measured move would be based on Wednesday’s low. The target would be around 1960.
Monday might gap down. Since there was a gap up on October 31, all of the trading since then would become an island top. Although the gap down would likely fill, if it stayed open, it could become a measuring gap. The projection down would be to just above 1900.
Since the October rally was so extreme, the correction down could be surprisingly big and correct more than 2/3rds of the rally. If so, it would probably do so in a bear spike and channel pattern where the channel would have three pushes down. The bulls would then see that as a wedge bull flag. They would look for a bull breakout and a strong bull breakout above that bull flag.
Traders can see the end of the day bar-by-bar price action report by signing up for free at BrooksPriceAction.com. I talk about the detailed Emini price action real-time throughout the day in the BrooksPriceAction.com trading room, and a 2 day free trial is available.
When I mention time, it is USA Pacific Standard Time (the Emini day session opens at 6:30 am PST, and closes at 1:15 pm PST). You can read background information on the intraday market reports on the Intraday Market Update page.


