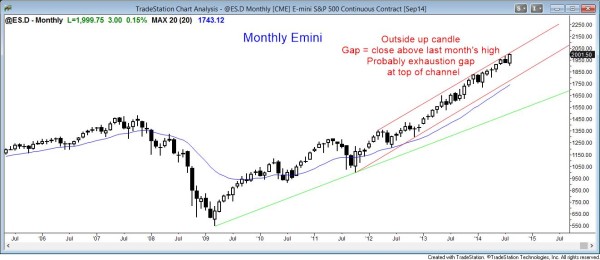
The monthly S&P500 Emini candle chart is in a strong bull trend

The S&P500 Emini monthly chart is in a strong bull trend, although it is overbought.
Although the monthly S&P500 Emini chart is in a buy climax at the top of the bull channel, it is still strong bull trend and there is no sign of a top. A small pullback bull trend is the strongest type of bull trend and the first reversal is usually limited to a few bars. A few monthly bars can be 100 points or more, and it can correspond to a bear trend on the daily chart. However, the probability is that it will be bought because there is such strong buying pressure on the monthly candle chart.
Less likely, there will be either a huge bear breakout or an endless pullback that grows for 20 or more months. Either of these situations can flip the chart to a bear trend, but both are unlikely.
I have mentioned that the Emini and S&P500 cash index monthly charts are overbought. The Emini has been this many points away from the moving average only three other times in 20 years. Also, it has not touched the moving average in 25 bars (months), and this, too, has happened only 3 other times in 20 years. After each instance, the S&P500 reversed to the moving average and the reversals were at least 20%. The Emini has also not had a 10% correction in 3 years. This has only happened twice in the past 20 years.
As overbought as it is, it can become much more overbought before it finally corrects. For example, the rally in the monthly Emini that ended in 2007 went 5 years without a 10 % pullback. The current rally would have to last another 2 years to match that.
August was another outside up candle. There was a gap between its close and the high of the July candle. This gap might be a measuring gap and lead to a measured move up from the August low to the July high. However, when any sign of strength like this forms late in a trend, especially at the top of the bull channel, the gap is more likely an exhaustion gap. To fill the gap, the Emini simply needs to dip below the July high.
August as an entry bar for the bears who shorted below the July low. July was a small bear reversal bar. Traders want to to see how September closes. The bears want a bear bar. It does not matter if the candle is an inside bar, or if September rallies above August and reverses down and forms a bear reversal candle. If it is a bear candle, especially if it has a good size body and closes on its low, the bears will see it as a 2nd entry sell signal (July was the first but the short failed once August went above the July high).
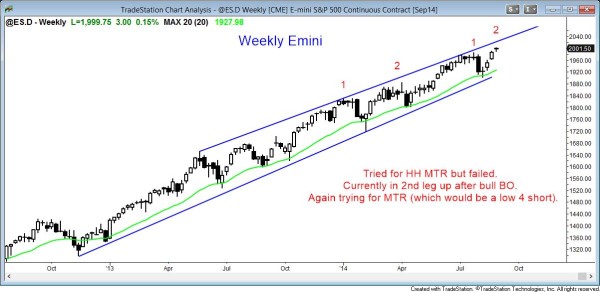
Price action on the weekly S&P500 Emini candle chart: possible buy climax at the top of the bull channel

The S&P500 weekly chart is in a strong bull trend, but it is at the top of the channel and it will probably soon evolve into a trading range.
The S&P500 Emini monthly chart is making a second attempt at a major trend reversal at the top of the bull channel. The first top was in April and it failed. Breakouts above failed tops typically go for two legs, and then the stock market usually enters a big trading range. The current rally is the second leg up. A trading range is therefore likely soon. Bears will begin to short above prior highs, like the July high, and scale in higher, betting that the pullbacks will get deeper. Bulls will begin to take profits above prior highs and only buy again on pullbacks.
This means that the bulls and bears will soon buy low, sell high, and scalp. This is the hallmark of a trading range, and this type of price action will probably begin soon since the chart looks like it might be creating a low 4 sell setup. It had a low 2 in April that failed. The Emini then broke to the upside and is now in its second leg up. This creates a total of four pushes up. If some selling pressure begins to develop, traders will see it as a sign that the Emini is converting from a bull channel into a trading range. As more traders see it, they will begin to buy low, sell high, scale into both, and take quick profits (scalp). Trading range traders are looking for selling pressure before switching from bull trend trading to trading range trading. Until it develops, the bull trend is still in effect.
Traders can see the end of the day bar-by-bar price action report by signing up for free at BrooksPriceAction.com. I talk about the detailed Emini price action real-time throughout the day in the BrooksPriceAction.com trading room, and a 2 day free trial is available.
When I mention time, it is USA Pacific Standard Time (the Emini day session opens at 6:30 am PST, and closes at 1:15 pm PST). You can read background information on the intraday market reports on the Intraday Market Update page.

