Monthly S&P500 Emini futures candlestick chart: Testing all-time high
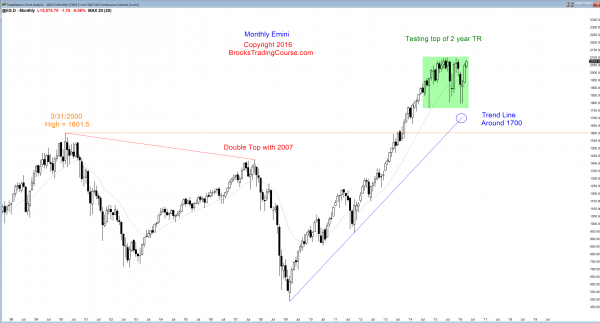
The monthly S&P500 Emini futures candlestick chart has had 3 strong bull trend bars, but it has not yet broken above the top of the 2 year trading range.
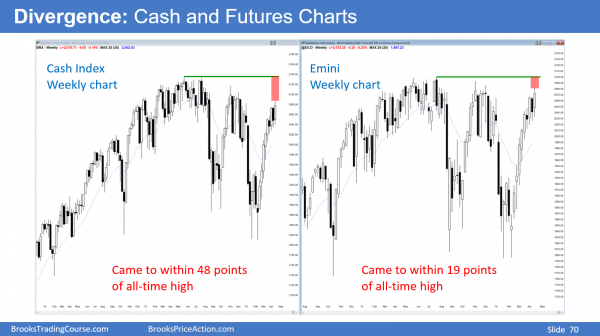
On the monthly S&P500 Emini futures candlestick chart, the Emini is still at the top of its 2 year trading range, but the current leg up has been strong. This increases the chances of a breakout to a new all-time high. The Emini came to within about 19 points of the July all-time high on Thursday. The cash index is still about 48 points below its high (see weekly charts below). This means that the Emini could hit a new high and the cash index could turn down from below its high.
Divergences are overrated and are much less important that what TV and websites make them sound. Like all reversal setups, even the best ones only have a 40% chance of leading to a reversal. The Emini is still in its trading range, and although the momentum up is enough to create about a 50% chance of a breakout over the next month, until there is a breakout, there is no breakout. The bears still have a 50% chance of a reversal down.
Weekly S&P500 Emini futures candlestick chart: Buy climax at resistance
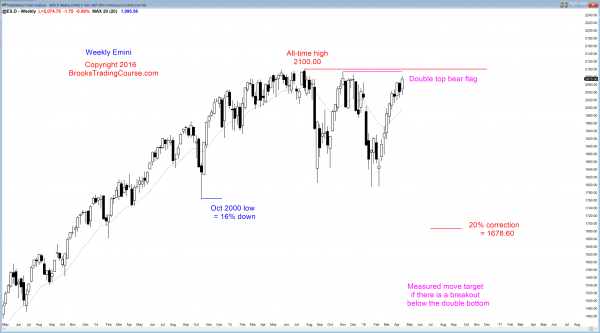
The weekly S&P500 Emini futures candlestick chart has a micro wedge in a buy climax, but there are still magnets above and no sign of a reversal yet.
The weekly S&P500 Cash Index came to within 48 points of its all-time high, but the Emini futures candlestick chart came to within 19 points of its all-time high. This is a divergence.
The weekly S&P500 Emini futures candlestick chart has had alternating bull and bear bars for 5 weeks. This is the 3rd push up and therefore a micro wedge top in an overbought rally at the top of a trading range, but the channel up is tight. The first reversal down will probably be minor, which means it would probably result in a trading range instead of a reversal into a bear trend.
The bulls are testing the 3 highs in the October to November trading range. They want a breakout above all 3 and then a new all-time high.
The bears want a reversal down. They would then see the rally of the past 2 months as simply a test of the top of that trading range. The pattern would be a double top, just below the all-time high, and it would therefore be a double top lower high major trend reversal. Like all major trend reversals, the probability that it would lead to a reversal and not just a trading range is only 40%. However, if the reversal down begins to form big bear trend bars, the probability of further down would be 60%.
Everyone is aware of the conflicting forces. The momentum up has been unusually strong and therefore favors the bulls. However, the Emini is testing the top of a 2 year trading range, and the resistance so far has held. It is a 50-50 market at this point. Many traders are waiting for a breakout up or down, or for a small trading range. If there is a small trading range, the bulls will buy above a small bull reversal bar near the bottom of the range, and the bears will sell below a small bear reversal bar near the top.
Daily S&P500 Emini futures candlestick chart: Candlestick pattern is a possible Final Flag
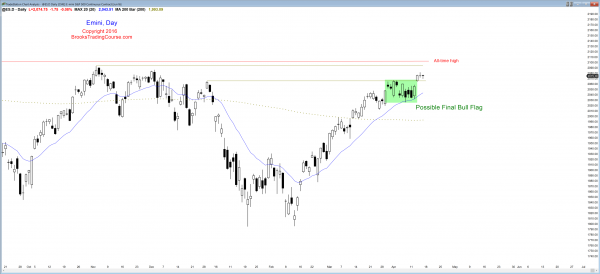
The daily S&P500 Emini futures candlestick chart is broke above a 3 week tight trading range that formed late in a bull trend. That increases the chances that the bull breakout will fail, and the trading range would then be the Final Bull Flag before a pullback.
The daily S&P500 Emini futures candlestick chart had a gap up when it broke above a 3 week trading range. The follow-through so far has been weak, but that is what happens about 50% of the time when the market gaps up as it breaks out. The bears want a reversal down or a gap down, which would create an island top. The bulls do not mind the bad follow-through as long as the rally resumes within a few days.
Because the 3 week trading range formed after the Emini rallied for 20 or more bars, it might be the https://www.brookstradingcourse.com/price-action/10-best-price-action-trading-patterns/#final-flags. This increases the chances that the Wednesday bull breakout will fail. However, there are magnets above. These are the November and December highs, and the all-time high, and all are within 20 points of this week’s high. They might be close enough so that the Emini will not be able to escape their magnetic field.
The next few weeks could be interesting because the bulls might finally get a new all-time high. However, they would be doing it in an overbought market, and that increases the chances the the breakout might not go far before it pulls back. The breakout might even fail because of the divergence with the cash index. The probability of higher prices was high in February and early March. The market is much less certain here, and that increases the chances of a trading range over the next month.
March and April are historically the most bullish consecutive months of the year. You often hear, “Sell in May and go away.” That is because May through early October is the weakest time of the year. With the rally as climactic as it has been on the weekly and daily charts, the chance of a trading range in May than is the chance of a strong rally far above the all-time high.
Traders can see the end of the day bar-by-bar price action report by signing up for free at BrooksPriceAction.com. I talk about the detailed Emini price action real-time throughout the day in the BrooksPriceAction.com trading room, and a 2 day free trial is available.
When I mention time, it is USA Pacific Standard Time (the Emini day session opens at 6:30 am PST, and closes at 1:15 pm PST). You can read background information on the intraday market reports on the Intraday Market Update page.


Al,
Thank you for the weekend update. It is exciting to read this information as it is happening, and apply what I have absorbed going into next week. Your grasp of the market is phenomenal, and a great learning experience in trying to understand Price Action.