Monthly S&P500 Emini futures candlestick chart:
Weak buy signal
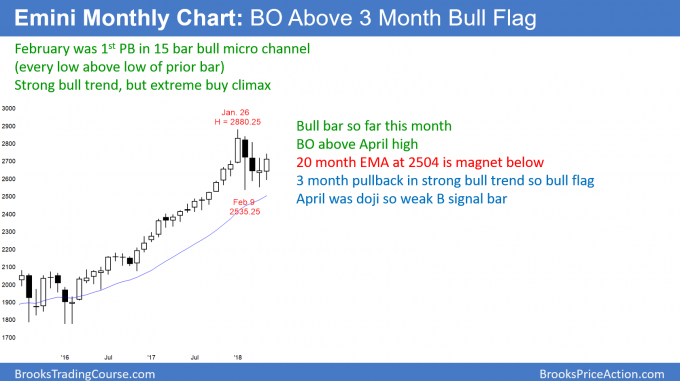
The monthly S&P500 Emini futures candlestick chart traded above the April high. This triggered a buy signal. However, April was a doji bar and therefore a weak signal bar. So far, May is a bull bar, but it is currently only at the April high and not far above.
The monthly S&P500 Emini futures candlestick chart has a 4 month bull flag. Since May broke above last month’s high, the bulls hope that the bull trend is resuming. Yet, each candle stick for the past 3 months has had prominent tails. This is a tight trading range and a magnet. It resists breakouts. Therefore, the bulls need May to close on its high, and preferably far above the April high. In addition, they need June to be a bull trend bar as well. Otherwise, the odds favor more sideways bars in the 4 month tight trading range.
The bulls had a 15 month bull micro channel that ended when February traded below the January low. After such a strong bull trend, there is only a 20% chance of a bear trend on the monthly chart without at least a small double top. Therefore, the downside risk is probably limited to a 5 – 10 bar pullback and maybe a tested below the 20 month EMA. If the Emini pulls back to the EMA, it will likely fall at least 30 – 50 points below. That means that a break below the February low would probably continue down to at least 2450.
Weekly S&P500 Emini futures candlestick chart:
Bar follow-through after last week’s breakout above a triangle
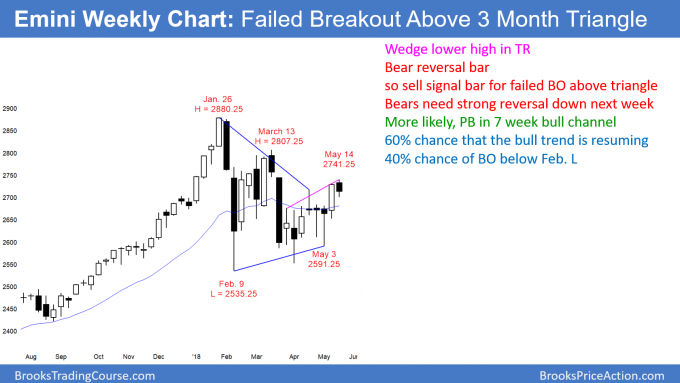
The weekly S&P500 Emini futures candlestick chart this week was a bear bar. This is bad follow-through after last week’s breakout above a 3 month triangle.
The weekly S&P500 Emini futures candlestick chart broke above a 3 month triangle two weeks ago, but this past week was a bear bar. That lack of follow-through buying reduces the chance that the breakout will be successful. Fifty percent of triangle breakouts fail.
The bears see this week as a sell signal bar for a failed breakout. Since the bar is not big, it is not a strong sell setup. The probability still slightly favors the bulls. The bulls need follow-through buying next week. If they fail to get it, the trading range is likely to continue.
Alternatively, if the bears get a big bear bar next week, then the bull breakout will have failed. The weekly chart would then either stay sideways or continue to fall and have bear breakout.
Daily S&P500 Emini futures candlestick chart:
Emini weak bull flag after breakout above April high
The daily S&P500 Emini futures candlestick chart pulled back this week after a breakout above the April 18 major lower high. The bears have a micro double top, but the 4 day tight trading range is more likely a bull flag.
The daily S&P500 Emini futures candlestick chart has been oscillating around the April 18 major lower high for 7 days. The bulls need follow-through buying next week. Since the rally from the May low was strong, the odds favor at least slightly higher prices next week.
However, the bears see Friday as a 2nd entry short for a failed breakout above the April 18 lower high. If they get 2 big bear trend days next week, they will probably get another test back down to the bottom of the 4 month trading range.
Traders can see the end of the day bar-by-bar price action report by signing up for free at BrooksPriceAction.com. I talk about the detailed Emini price action real-time throughout the day in the BrooksPriceAction.com trading room. We offer a 2 day free trial.
When I mention time, it is USA Pacific Standard Time (the Emini day session opens at 6:30 am PST, and closes at 1:15 pm PST). You can read background information on the intraday market reports on the Intraday Market Update page.


Al,
After failing to recognize Thursday’s parabolic wedge climax I’ve been studying… Do you consider the tight bull channel of 2017 to be a parabolic wedge? If so, does this increase the chance that the January high never gets tested?
Thanks.
Dave
Look at the weekly chart above. It does have a parabolic wedge top.
I don’t know if you read my weekend posts during the 2nd half of 2017. I repeatedly said that the buy climaxes on the daily, weekly, and monthly charts were the most extreme in the history of the stock market.
However, I also said that the monthly chart had a 15 bar bull micro channel. There is only a 20 % chance of the monthly chart entering a bear trend without at least a micro double top. The current May rally might be that double top. However, the 2nd top will probably have to get closer to the 1st top (January) before traders conclude that the high was adequately tested.
Al,
I completely agree with you that 2800 level will be reached soon. But what I do not understand is why the institutions buy this market against these bad geopolitical processes? Or they completely disregard the very alarming events that happen almost every week? And what about you, Al? Do you take into considerations the geopolitical context or not?
The market instantly prices in all news. There are hundreds of big institutions that know far more news than you and I could possibly could know, and they understand it better than you and I do. Furthermore, they have excellent algorithms that tell them what the price should be based on all knowable variables, which means all news. What appears alarming to you is alarming to them as well. The current price reflects that, and the charts tell us that there is not any significant risk at the moment. If there was, the market would be collapsing down to a price that would reflect where the economy would be several months from now.
Bad compared to what? The first half of the 20th century? These are relatively peaceful and prosperous times if you look at things in a historical perspective. We haven’t reached the next financial crisis yet, but we’ll probably encounter one sooner or later.