Trading Update: Monday August 14, 2023
S&P Emini pre-open market analysis
Emini daily chart

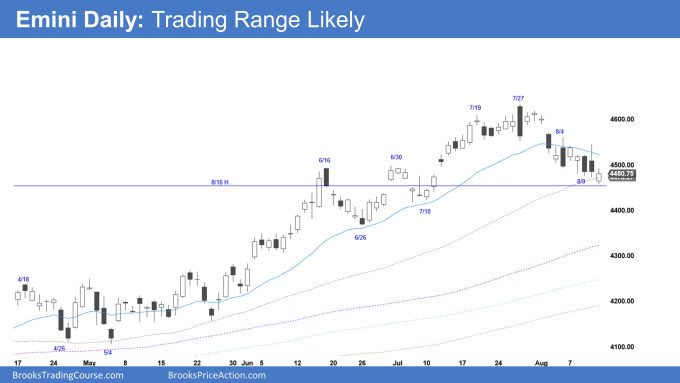
- The Emini has been in a tight bear channel for several bars. However, the channel down has several overlapping bars, increasing the odds of sideways trading soon.
- The bears hope the August selloff will lead to an endless pullback and downside breakout. The bears will likely soon become disappointed, and the market will begin to go sideways.
- The channel down is a breakout on a higher time frame. This increases the odds that any reversal up will be minor and lead to a trading range and not an upside breakout.
- The bulls want a strong entry bar following Friday’s buy signal bar. This would increase the odds of at least a small second leg up and the transition into a trading range.
- The bulls might get a couple of legs up and set up a bear flag, allowing the bears to get a second leg down.
- Overall, traders should expect sideways for the next several bars and trading range price action.
Emini 5-minute chart and what to expect today
- Emini is down 6 points in the overnight Globex session.
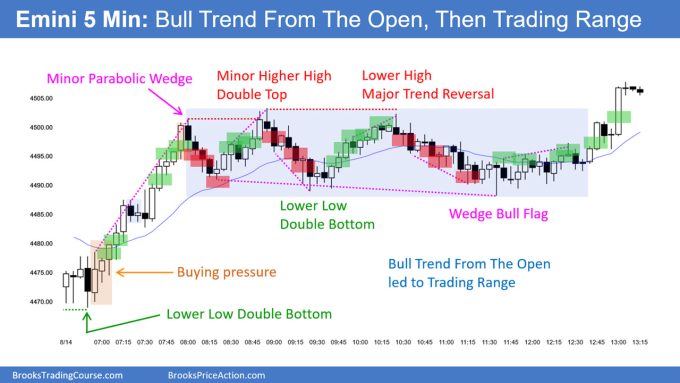
- The bulls got intense buying pressure during the overnight session. However, the bears were able to form a deep pullback.
- The rally last night is strong enough that the Bulls will try to get a second leg up. However, because of the deep pullback, any second leg up will probably lead to sideways trading.
- Traders should pay close attention to the day’s open and last Friday’s high. The bulls want, at a minimum, a second consecutive bull bar on the daily chart. Ideally, the bulls want a strong entry bar following last Friday’s buy signal bar.
- Traders should expect a lot of sideways trading during the opening session. Traders should consider not trading during the first 6-12 bars unless they are comfortable making quick decisions and trading with limit orders.
- It is common for the open to get breakouts that fail and reverse. This can cause traders to take significant losses on the open and spend the rest of the day trying to recover their losses.
- Overall, traders should be neutral going into the open.
Friday’s Emini setups

Al created the SP500 Emini charts.
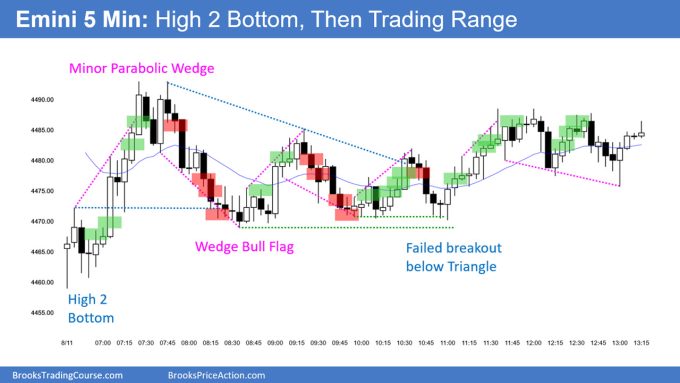
Here are several reasonable stop entry setups from Friday. I show each buy entry with a green rectangle and each sell entry with a red rectangle. Buyers of both the Brooks Trading Course and Encyclopedia of Chart Patterns have access to a near 4-year library of more detailed explanations of swing trade setups (see Online Course/BTC Daily Setups). Encyclopedia members get current daily charts added to Encyclopedia.
My goal with these charts is to present an Always In perspective. If a trader was trying to be Always In or nearly Always In a position all day, and he was not currently in the market, these entries would be logical times for him to enter. These therefore are swing entries.
It is important to understand that most swing setups do not lead to swing trades. As soon as traders are disappointed, many exit. Those who exit prefer to get out with a small profit (scalp), but often have to exit with a small loss.
If the risk is too big for your account, you should wait for trades with less risk or trade an alternative market like the Micro Emini.
EURUSD Forex market trading strategies
EURUSD Forex daily chart

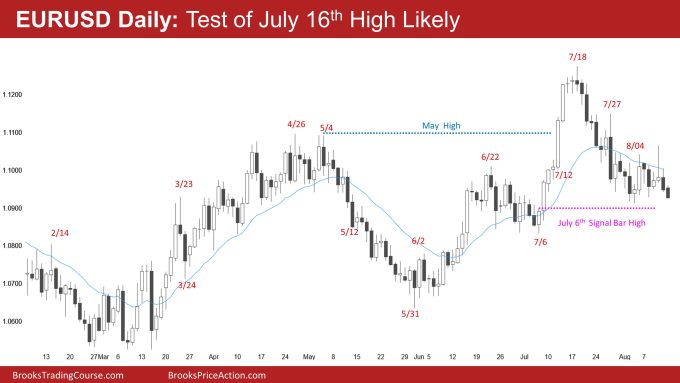
- The EURUSD will likely test the July 6th buy signal bar high in the next few days.
- The July 6th buy signal bar led to a strong rally and trapped bears above its high. Since the market is likely in a trading range, the odds are that the breakout point (gap) above the July 6th high will close, allowing bears to make money.
- The bears are hopeful that the tight trading range over the past few weeks will lead to a double top and measuring move below the July 6th low.
- The rally up to the July high was strong, and there is a 60% chance that those bulls will be able to scale in lower and exit at their original entry. This means that bulls will look to buy above a strong buy signal bar expecting a test of the July high.
- Overall, the market is in a tight trading range within a larger trading range. If one side had a high probability, the market would not go sideways. This means traders should expect both the bulls and bears to be disappointed.
Summary of today’s S&P Emini price action

Al created the SP500 Emini charts.
End of day video review
Here is YouTube link if video popup blocked:
Emini End of Day Review – Monday August 14, 2023 – Brad Wolff
See the weekly update for a discussion of the price action on the weekly chart and for what to expect going into next week.
Trading Room
Al Brooks and other presenters talk about the detailed Emini price action real-time each day in the BrooksPriceAction.com trading room days. We offer a 2 day free trial.
Charts use Pacific Time
When times are mentioned, it is USA Pacific Time. The Emini day session charts begin at 6:30 am PT and end at 1:15 pm PT which is 15 minutes after the NYSE closes. You can read background information on the market reports on the Market Update page.


Genuinely appreciate your analysis, Brad! Thx for taking the time and sharing with the trading community.
Thank you so much for your awesome analysis.
I would be grateful if you could analyze 5-min EURUSD chart.