Trading Update: Thursday July 6, 2023
S&P Emini pre-open market analysis
Emini daily chart
- The Emini will likely test into the June 30th gap on the daily chart and pullback for a day or two.
- The Emini formed an inside bar with the June 30th Bull breakout bar.
- The bulls hope that the rally will continue; however, the market will likely have to pull back for a couple of days.
- The bears want to retest the June 29th breakout point high at a minimum. This is an area where the bears gave up on the idea of the rally up to June 29th being a bear flag. This means the high of June 29th is a magnet and will likely act as support if the market reaches it.
- The bears hope the market is forming a double top with June 16th. Next, they want a breakout below the neckline (June 26th and a measured move down.
- More likely, the market will continue sideways for the next couple of weeks.
- The bulls will probably get a second leg up since the bears will likely buy the first reversal down. These bears are trapped in a losing trade and will likely buy back shorts for a smaller loss. The Bulls know this and will probably look to buy as well.
- Overall, the Bulls will probably get a second leg up. Since the odds favor a second leg, traders must be prepared for the opposite and, instead, an endless pullback that leads to a double top and measured move down.
Emini 5-minute chart and what to expect today
- Emini is down 35 points in the overnight Globex session.
- The Overnight Globex market sold off below yesterday’s low, which has gone sideways for several hours.
- The bears want today to close on its low and damage the bull case on the daily chart.
The Bulls want the opposite and will try to get a rally on the open. - Traders should expect a lot of trading range price action on the open. As I often say, most traders should consider not trading for the first 6-12 bars as the market will probably be in a limit order market.
- Most traders should focus on catching the opening swing trade that often begins by the end of the second hour. It is common for the market to form a double top/bottom or a wedge top/bottom before the opening swing trade begins.
- Lastly, traders should be ready for anything on the open and trade the chart in front of them. While the odds favor a trading range open, a trader cannot be in denial if the market starts to form trending behavior.
Yesterday’s Emini setups

Al created the SP500 Emini charts.
Here are several reasonable stop entry setups from yesterday. I show each buy entry with a green rectangle and each sell entry with a red rectangle. Buyers of both the Brooks Trading Course and Encyclopedia of Chart Patterns have access to a near 4-year library of more detailed explanations of swing trade setups (see Online Course/BTC Daily Setups). Encyclopedia members get current daily charts added to Encyclopedia.
My goal with these charts is to present an Always In perspective. If a trader was trying to be Always In or nearly Always In a position all day, and he was not currently in the market, these entries would be logical times for him to enter. These therefore are swing entries.
It is important to understand that most swing setups do not lead to swing trades. As soon as traders are disappointed, many exit. Those who exit prefer to get out with a small profit (scalp), but often have to exit with a small loss.
If the risk is too big for your account, you should wait for trades with less risk or trade an alternative market like the Micro Emini.
EURUSD Forex market trading strategies
EURUSD Forex daily chart

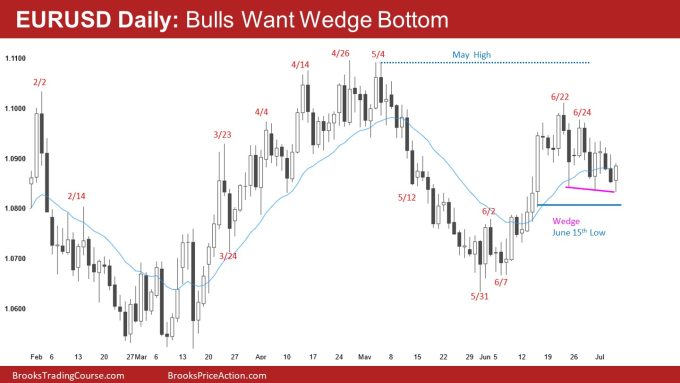
- The EURUUSD is trying to form a wedge bottom bull flag just above the June 15th Low.
- The bulls want the trend resumption up after the rally up to June 22nd.
- The bulls want signs of strength today. One sign of strength would be today closing on its high, forming a strong buy signal bar. The bears will try to prevent this by creating a weak buy signal bar close.
- The bears are hopeful that any rally that follows today will be weak and lead to a trading range instead of a strong bull rally.
- Overall, traders will pay close attention to today’s close to see how strong of a buy signal bar the bulls can make. Next, traders will pay attention to tomorrow’s entry bar if the bulls create a decent buy signal bar.
Summary of today’s S&P Emini price action

Al created the SP500 Emini charts.
End of day video review
Live stream videos to follow Monday, Wednesday and Friday (subject to change).
See the weekly update for a discussion of the price action on the weekly chart and for what to expect going into next week.
Trading Room
Al Brooks and other presenters talk about the detailed Emini price action real-time each day in the BrooksPriceAction.com trading room days. We offer a 2 day free trial.
Charts use Pacific Time
When times are mentioned, it is USA Pacific Time. The Emini day session charts begin at 6:30 am PT and end at 1:15 pm PT which is 15 minutes after the NYSE closes. You can read background information on the market reports on the Market Update page.


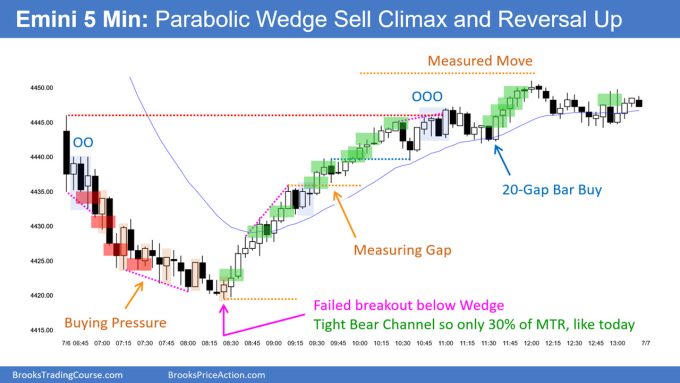
Today in the first 2 hours, there were 4 good reversal bull bars and not a single one worked. The one that worked had tail above and the next 3 bull bars had tails above. Seeing all those good bull bars and weak bear bars I kept buying bellow bars scaling in, hoping for a reversal, and I gave up right on the low of the day.
That is a common problem when trying to bet on an opening reversal. You had the right idea but needed to give the market more room (your stop was too close).
Remember to think about what a 15- or even 30-minute chart of the opening price action looks like.
Yes, it had many bull bars, but the selloff was tight, meaning it was a bear breakout on a higher time frame.
I agree with you overall. I would be careful about trading this way, however. It requires very wide stops and scaling in. Therefore the risk/reward is often bad, so you have to be confident in your Price Action Analysis.
On the same subject Brad, I saw the bull pressure and kept my average entry level below the ema. The idea was to exit when PA will approach ema close enough and so I did at the high of bar 26 working under the notion bear will await such correction and re-enter. Price haven’t reversed and continue higher, wondering if my working assumption was right and had I missed and sign PA has no plan to reverse down from ema as it usually does?
The market rallied from the low to the EMA in a tight bull channel, so the first reversal was likely to be minor and lead to at least a second leg up.