Trading Update: Tuesday April 2, 2024
S&P Emini pre-open market analysis
Emini daily chart
- The Emini formed a double top with the March 21st high last Thursday.
- The bears want a break below the March 26th neckline and a test of the moving average, which they will probably get.
- While the market has been in a small pullback bull trend for most of the year, the odds are breakout points such as the March 8th high will begin to close soon. The Bears tried to close it on March 26th and failed.
- They hope they will get a second leg below the March 26th low and the March 8th high.
- The Bulls will try to defend the March 8th high and keep the breakout point open. However, the odds are likely against it. The market will probably fall below the March 8th breakout point in the next day or two.
Emini 5-minute chart and what to expect today
- The Emini is likely going to gap down on the open.
- This means traders will expect an attempt at a second leg down on the open.
- Because the market will likely be far from the moving average, traders will expect it to go sideways on the open and then get closer to it.
- If the open gets a trend from the open bear trend, it will probably be limited and evolve into a trading range soon. This increases the risk of a trading range open and not a bear trend from the open.
- Because the market is going to gap down, traders must consider the possibility of a bear trend day, with the bears attempting to resume the trend later in the day. If one considers the opening gap as the first leg, this would create a second leg down.
Yesterday’s Emini setups

Richard created the SP500 Emini charts. Al travelling.
Here are reasonable stop entry setups from yesterday. I show each buy entry bar with a green arrow and each sell entry bar with a red arrow. Buyers of both the Brooks Trading Course and Encyclopedia of Chart Patterns have access to a near 4-year library of more detailed explanations of swing trade setups (see Online Course/BTC Daily Setups). Encyclopedia members get current daily charts added to Encyclopedia.
My goal with these charts is to present an Always In perspective. If a trader was trying to be Always In or nearly Always In a position all day, and he was not currently in the market, these entries would be logical times for him to enter. These therefore are swing entries.
It is important to understand that most swing setups do not lead to swing trades. As soon as traders are disappointed, many exit. Those who exit prefer to get out with a small profit (scalp), but often have to exit with a small loss.
If the risk is too big for your account, you should wait for trades with less risk or trade an alternative market like the Micro Emini.
EURUSD Forex market trading strategies
EURUSD Forex daily chart
- The EURUSD reached the February 14th buy signal bar high and reversed up today after yesterday’s bear breakout bar.
- The bears were hopeful that yesterday’s strength would create follow-through selling. However, the bears failed, and the bulls are getting a strong reversal bar today.
- The bulls are hopeful they will be able to create a strong bull reversal bar today. If today is a strong reversal bar, that might convince the bears to exit above its high.
Summary of today’s S&P Emini price action

Richard created the SP500 Emini charts. Al travelling.
End of day video review
Live stream videos to follow Monday, Wednesday and Friday (subject to change).
See the weekly update for a discussion of the price action on the weekly chart and for what to expect going into next week.
Trading Room
Al Brooks and other presenters talk about the detailed Emini price action real-time each day in the BrooksPriceAction.com trading room days. We offer a 2 day free trial.
Charts use Pacific Time
When times are mentioned, it is USA Pacific Time. The Emini day session charts begin at 6:30 am PT and end at 1:15 pm PT which is 15 minutes after the NYSE closes. You can read background information on the market reports on the Market Update page.


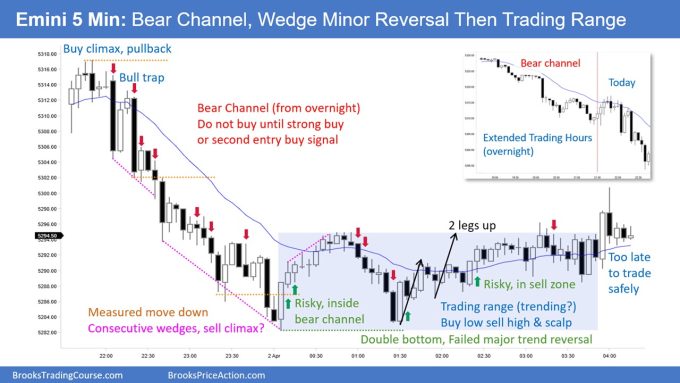
Hi Richard. You marked the chart as do not buy until strong buy.
I thought bar 8 was a strong LL DB failed BO below L od the day.
Was it a bad buy? Thanks
Bar 7 was a very strong bear BO bar that probably made the market AIS and would be expected to have at least a second leg down. Big bars like 7 often have deep PBs and Bar 8 forced you to buy at the EMA right where sellers would be expected to come back in.
Hi Grzegorz. Andrew’s analysis is as I saw it, especially given that I trade the ETH so market was already in a bear channel (see chart inset). Limit order bull scalpers would have made money on bar 8 pullback though.