Market Overview: Weekend Market Update
The Emini has rallied strongly for 2 weeks, but the rally might be a bull leg in the January trading range. However, there is currently only a 30% chance that February will reverse back down to the low of the month in the final 2 weeks.
The bond futures market has been sideways for 6 months and there is no sign that it is about to break out.
The EURUSD Forex market is in a sell climax. A 2 week short covering rally will probably begin within a week or two.
30 year Treasury bond Futures market:
Sideways to up for another couple months
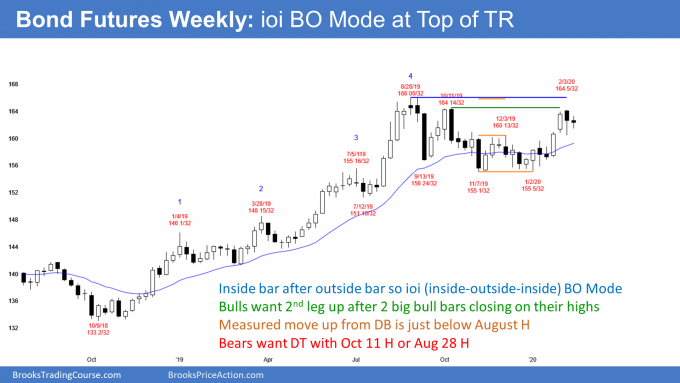
The 30 year Treasury bond futures had an inside bar this week on the weekly chart. Last week was an outside bar. This is therefore an ioi (inside-outside-inside) Breakout Mode pattern.
A Breakout Mode pattern has about a 50% chance of a successful bull breakout and a 50% chance of a successful bear breakout. Furthermore, there is a 50% chance that the first breakout will reverse.
The bulls see the 2 big bull bars at the end of January as a breakout above a 4 month bull flag. For them, the past 2 weeks are forming a pullback from that breakout. They expect the bull trend to resume either next week or the following week. They would like a break far above the August all-time high.
However, I said many times that Americans will not accept negative interest rates. If this rally continues much higher, that is what Americans will be facing. Politicians know that and they will prevent it from happening. How? They could print money to create inflation or they could greatly increase the sale of bonds. That supply would drive the price down. There are other things they could do as well.
9 year nested wedge top
It is important to note that the bond market formed a 9 year nested wedge top on the monthly chart in July 2016. The current rally is testing that high. A test of a wedge top happens about half of the time before there is a reversal down.
The bulls want a strong break above the wedge top and then a measured move up based on the height of the 4 year range. There would normally be a 50% chance for the bulls. But this is not normal. Americans will not tolerate much lower interest rates. Consequently, there is probably less than a 40% chance that the 2019 rally will continue far above the 2016 high.
The bond market has been in a bull trend for 30 years on the monthly chart. Once it reverses, it will probably be in a bear trend for a decade or two. Since this a monthly chart, the transition from a bull trend to a bear trend can take many years. So far, the market has been sideways for almost 4 years. There is no reversal yet. But there is no clear resumption of the 30 year bull trend either.
Weak bull flag on the monthly chart
The monthly chart had 4 consecutive bear bars since September after the 2019 buy climax. Even though January was a big bull bar, it would be unusual for a bull breakout above 4 bear bars after a buy climax to lead to a resumption of the bull trend. More often, the rally lasts 1 – 3 bars (here, months) and turns down from around the prior high.
January was a surprisingly big bull bar on the monthly chart. A bull Surprise Bar typically will have at least a small 2nd leg sideways to up. As a result, even though February so far is a bear bar, the bond market will probably be sideways to up for at least another month or two. This is true even if March trades below the February low.
EURUSD weekly Forex chart:
Sell climax will likely lead to some short covering
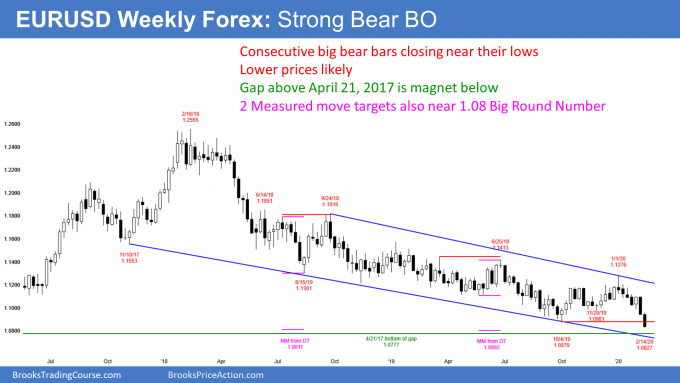
The EURUSD weekly Forex chart has sold off strongly for the past 2 weeks. It broke below the October low, which was both the bottom of the 2 year bear trend and the 6 month trading range.
April 2017 gap at 1.0777 is magnet below
For 6 months, I have mentioned that the 1.08 is an important magnet. The biggest reason is that there is a gap above the a April 7, 2017 high of 1.0777 on the daily can weekly chart.
Open gaps are rare in the Forex market. Most gaps close. The EURUSD is now near enough to this gap to make it likely that it will test the gap and probably close it. But because the daily chart is so oversold, there will probably be a bounce first.
There are other magnets around that gap. 1.08 is a Big Round Number and therefore a magnet. In addition, there were a couple double top bear flags over the past 2 years with measured move targets around 1.08.
EURUSD might test 2017 bottom of bull trend or even par (1.0000)
Will the selloff continue down to below the January 2017 low of 1.0340? That was the start of a strong bull trend. The bulls want to keep this selloff from falling below that low. They would then view this selloff as just a deep bull flag pullback from the rally to February 2018.
The bears, however, not only want a break below the bull trend low, they want the EURUSD to fall to par (1.0000). The momentum down on the weekly chart is strong enough to get there. But trends resist change. Therefore it is still more likely that the 2 year selloff will end before falling below the 2017 start of the bull trend.
And even if it falls below, it would then be at the bottom of a 6 year trading range. That will likely result in many months of sideways trading or even a reversal up.
Daily chart should bounce within 2 weeks
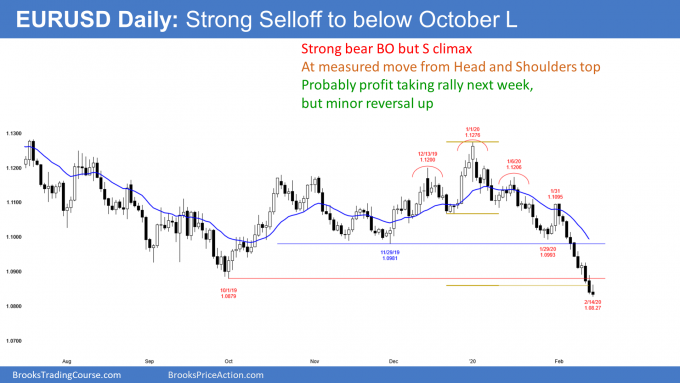
The daily chart has been in an unusually strong bear breakout for 2 weeks. However, it is important to note that the bulls formed a small bull reversal bar on Tuesday. While that might seem insignificant, it was a sign of early profit-taking.
When there is a bull bar in an extreme sell climax and then the selling resumes, there is usually a 2nd attempt to reverse up within a few bars. The bears will more aggressively take profits (short-covering) after that 2nd attempt. The bulls will buy as well.
Friday was a bear doji bar and a possible candidate for that 2nd attempt. However, most traders want to see a big bull bar closing on its high before they become confident that the bounce has begun. The selloff will probably continue at least a little more before the short covering rally begins.
After the bears take profits, they will not look to sell again just a few days later. If that was their plan, they would not have taken profits.
Once they take profits in an extreme sell climax, they know there is an increased risk of a reversal up into a bull trend. But traders also understand that the 1st reversal up is typically minor. They want to see some kind of double bottom before concluding that the trend has reversed.
The bears usually allow the bulls to make at least a couple attempts to create a bull trend reversal. If the bears sense that the bulls are failing twice, the bears begin to sell again. Therefore, a profit-taking rally after an extreme sell climax usually has at least 2 legs up and lasts about 10 or more bars.
Double bottom with October low
The bulls hope that this selloff is just a sell vacuum test of the October low. They want a rally up from here. That would then be a lower low double bottom. Friday is a weak buy signal bar and the context is reasonable. The short covering rally might be underway, but most traders want to see one or more big bull bars closing on their highs.
The bulls want a violent reversal up, similar to the one in the stock market after Christmas 2018 crash. However, that rarely happens. The 1st reversal up from a sell climax is typically minor.
Because this sell climax is extreme, the short covering could last a couple weeks. The bears typically sell again near some resistance. At a minimum, they would then expect a test of the low.
If the bulls then get a 2nd reversal up, that would be a double bottom with the sell climax low. They would then have a better chance of a bigger reversal up. Right now, the best they probably can get is a couple weeks of short covering, and then a test down or a resumption of the bear trend.
How far up will a short-covering rally go?
A short covering rally typically reaches some resistance level, like the 20 day EMA or a breakout point. A break below a major support level like the October low usually soon has a pullback to above that low. The next higher breakout point is the November low, which is just below the 1.10 Big Round Number.
Traders should expect a short covering rally to begin within a few days. It might have started on Friday, but most traders want to see a big bull bar before they become confident of a bounce.
Sometimes it results in the EURUSD going sideways for a week or two. But since this selling is so extreme and there are magnets about 150 pips above, the bear rally will probably go up to the EMA and maybe the November low.
Can this selloff continue down to par without more than a 2 – 3 day bounce? That would be unusual. Traders expect a short-covering rally to begin within the next week or so.
Monthly S&P500 Emini futures chart:
Breakout above sell signal bar
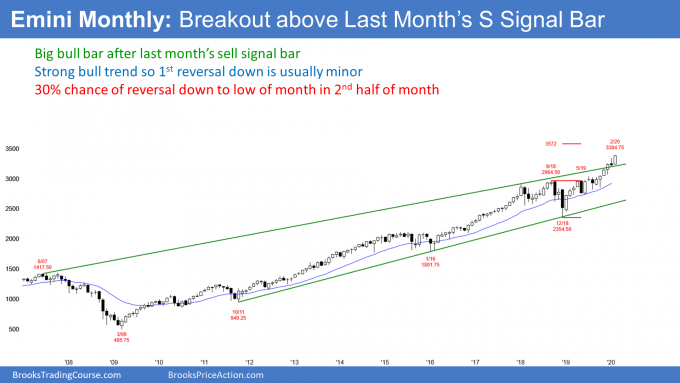
The monthly S&P500 Emini futures chart formed a bear reversal bar in January. However, instead of triggering the monthly sell signal by going below the January low, the Emini instead rallied to above the January high.
If February closes above the January high, February would then be a bull breakout bar. That would make higher prices likely in March. If March is up, April would probably be sideways to up as well. This is because March and April are historically the most bullish consecutive months of the year.
Can February reverse down in the final 2 weeks?
There is always a bear case. When there is a bear reversal bar, the next month also often has a big tail on top. If it does, there is then a micro double top, which is a sell signal.
For February to have a big tail on top, it has to rally and then sell off. It has rallied for the 1st half of the month. That tail on the top of the January candlestick increases the chance of a selloff in the 2nd half of February.
So that is the fight we will see over the next 2 weeks. Will the bulls get February to close above the January high, increasing the chance of higher prices in March? Or, will the bears get a reversal back down to the February low, creating a micro double top? The bears have a 30% chance of getting a reversal back to the February low by the end of the month. That would increase the chance of lower prices in March.
Because the 6 month bull trend is strong and the Emini has been in a bull trend for 10 years, the odds continue to favor at least slightly higher prices. But traders know that February might sell off in the final 2 weeks.
Weekly S&P500 Emini futures chart:
Breakout above January high, approaching Leg 1 = Leg 2 measured move target
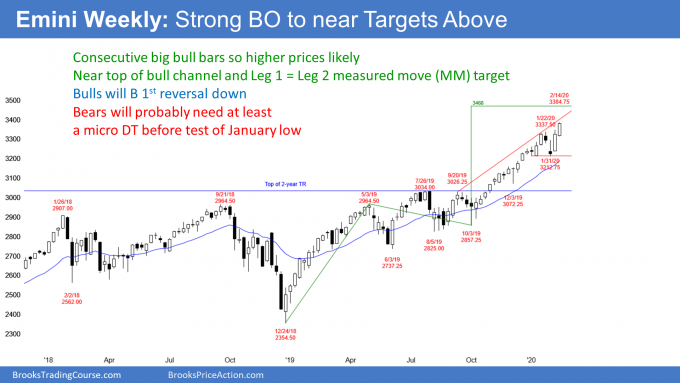
The title of my January 18 report was, “Emini 5% correction could begin in 3 weeks.” The selloff began a few days later. The reason why I said there would be a pullback was because of the consecutive big bull bars on the weekly chart in mid-January.
When there are consecutive big bull bars late in a bull trend, they attract profit-takers. The 1st target is the bottom of the 2 bull bars. The Emini fell 2 ticks below that target but then resumed back up. The selloff was a little more than 4%.
The weekly S&P500 Emini futures chart once again has a pair of consecutive big bull bars closing near their highs. However, the 2 week selloff relieved some of the buy climax. The bulls have a better chance of at least slightly higher prices.
Will the 2 week breakout succeed?
There is a bull trend channel line just above this week’s high. Also, there is a Leg 1 = Leg 2 measured move target above at 3468. Will the rally continue up to that target and the 3500 Big Round Number or will it test the January low?
The momentum up has been strong, but the Emini has been above the 20 week EMA for many bars. Also, January’s 4% selloff is a sign that the bears can be strong. Consequently, it is currently more likely that this rally will stall within the next couple of weeks.
Next week is important. This week broke above the January 22 previous high. If next week is also a bull bar, traders will expect higher prices over the next few weeks.
However, if next week is a bear bar, especially a bear bar closing near its low, traders will think that the 2 week breakout might fail. A bear bar would increase the chance of lower prices over the following week.
Daily S&P500 Emini futures chart:
Resumption of bull trend or bull leg in developing trading range?
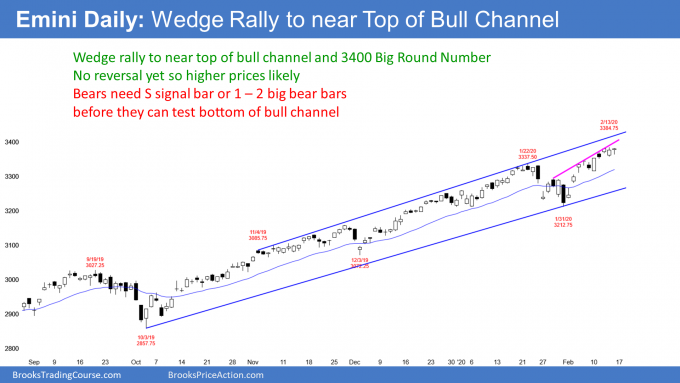
Friday was an inside day after an outside day on the daily S&P500 Emini futures chart. This is therefore an ioi (inside-outside-inside) Breakout Mode pattern. Since Friday had a bull body and the trend is up, a bull breakout is more likely. Furthermore, the bull body makes this a weak sell setup.
It is worth noting that the daily chart has had 3 pushes up that began with the January 29 high. The rally is therefore a wedge, which often leads to a reversal down. Since the bull channel is tight, this is a minor sell setup. The best the bears can probably get next week is a 2 – 3 day pullback. Traders expect at least slightly higher prices.
The bulls hope that the rally up from the January 31 low is another Small Pullback Bull Trend, like the 4 month rally from the October low. There is room to the top of the 5 month bull channel and that is a magnet above.
Also, the 2nd leg up to the February 6 high was strong enough to reset the count in the wedge rally. That could instead be a new 1st leg up. If so, traders hoping for a wedge top might get another brief leg up after a 1 – 2 day pullback from this week’s high (the new 2nd leg up in the wedge).
There are often several ways to draw wedge tops. No one knows in advance what the consensus choice it. But traders are aware that the Emini might get a wedge reversal down next week. A strong reversal down could continue down to the January low. If so, traders will conclude that the 2 week rally was just a bull leg in a trading range that began around Christmas. More likely, the Emini will be sideways to up again next week.
If there is a test of the January low in March and then a rally to a lower high, there would be a head and shoulders top. However, most head and shoulders tops do not lead to major trend reversals.
Next week should provide useful information
I know this is confusing. The important point is that traders are deciding if the 2 week rally is a resumption of the 4 month bull trend or just a bull leg in a trading range that began around Christmas.
There is no top yet. If the Emini gets a couple closes above 3400, then the bull trend is probably resuming. Traders will then look at other targets above, like the Leg 1 = Leg 2 measured move target on the weekly chart at 3468.
However, if next week begins to reverse down, traders will suspect that the rally was just a bull leg in the 2 month trading range. They will look for a bear leg and a test of the bottom of the range. That is the January low. Therefore, next week’s behavior will give traders information that will help them choose between these 2 alternatives.
Trading Room
Traders can see the end of the day bar-by-bar price action report by signing up for free at BrooksPriceAction.com. I talk about the detailed Emini price action real-time throughout the day in the BrooksPriceAction.com trading room. We offer a 2 day free trial.
Charts use Pacific Standard Time
When I mention time, it is USA Pacific Standard Time (the Emini day session opens at 6:30 am PST, and closes at 1:15 pm PST). You can read background information on the intraday market reports on the Market Update page.


Al, this day fell into the 10% category of taking out the high and low after the first 18 bars, yes? Do you see this happening more on an inside day?
The most important variables are a small range and a trading range price action coming into the day. An inside day is small and sideways so yes, an inside day is more likely than other types of days.