Trading Update: Wednesday March 9, 2022
Emini pre-open market analysis
Emini daily chart
- A strong Globex session reversal up retraced most of yesterday’s range.
- On Monday, the bears had a strong breakout bar, closing below the January low.
- The bears got follow-through yesterday, which increases the odds that the market will have to reach the February 24 low.
- While the bears were able to achieve follow-through, yesterday’s bar had a big tail on top and could not close on its low. This means that bears were not willing to sell the open of yesterday’s bar and wanted to sell higher such as a 50% pullback of Monday’s breakout, which is overlap, and a sign of a trading range
- Traders should be aware that while the bears got follow-through yesterday, it is still not breaking out below the February 24 low, and there are likely many bulls sitting on the sidelines waiting to buy a test of the February 24 low.
- If the bears are going to take control and get the bear breakout below the February 24 low, they need to take control of the market soon, or else more and more bulls will start buying as the market gets close to the February 24 low.
- Some traders (bull and bears) will buy before the market gets to the February 24 low if the market reverses up before reaching the low.
- The bulls still see a wedge bottom with December 3, January 24. If the bears get the failed breakout below February 24, traders will see the wedge bull flag starting over, with January 24 being the first push and February 24 as the second.
- The bulls are hopeful the market will set up a higher low major trend reversal at this price level and lead to a rally that possibly will test the all-time high.
- Today will probably be a trading range that would confuse the market and confirm the trading range price action the Emini has been in over the past 2 months.
- The bears want a strong bear bar today, which would increase the odds of a successful breakout below February, and the bulls want a strong bull bar today to set up a possible higher low major trend reversal.
Emini 5-minute chart and what to expect today
- Emini is up 100 points in the overnight Globex session.
- The bulls achieved a strong rally during the Globex session. Assuming the bulls can keep the market up at this price level, it would disappoint the bears and increase the odds that the market may reverse before reaching the February low.
- Since the February low is such an obvious target, the market may not reach it. This is because too many traders want to buy at the target that they start entering early if the market never gets to the target.
- Since the bulls have already rallied around 100 points in the Globex session, the day session may be small since the bulls may be exhausted, and if they can keep the market at this price level or around yesterday’s high, they will consider it a successful day.
- The open will have a big gap up, which means traders should expect a pullback to the moving average and less likely a trend from the open up or down.
- Traders should expect trading range price action on the open and possibly sideways to down and test the moving average.
- The bears know they will likely not be able to reverse the gap up, so they will try and damage the rally today as much as possible. One way would be to close today as a big bear bar.
Yesterday’s Emini setups

Al created the SP500 Emini charts.
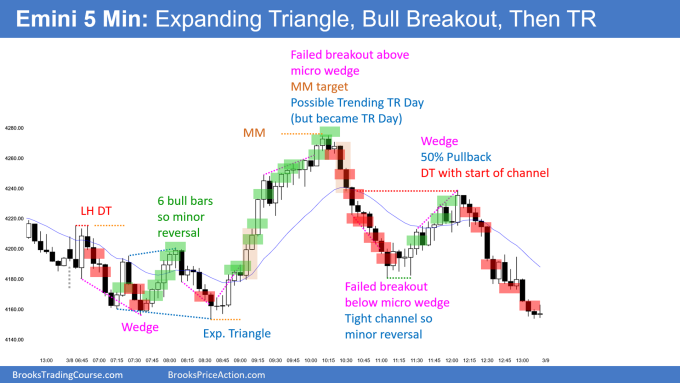
Here are several reasonable stop entry setups from yesterday. I show each buy entry with a green rectangle and each sell entry with a red rectangle. Buyers of both the Brooks Trading Course and Encyclopedia of Chart Patterns have access to a much more detailed explanation of the swing trades for each day (see Online Course/BTC Daily Setups).
My goal with these charts is to present an Always In perspective. If a trader was trying to be Always In or nearly Always In a position all day, and he was not currently in the market, these entries would be logical times for him to enter. These therefore are swing entries.
It is important to understand that most swing setups do not lead to swing trades. As soon as traders are disappointed, many exit. Those who exit prefer to get out with a small profit (scalp), but often have to exit with a small loss.
If the risk is too big for your account, you should wait for trades with less risk or trade an alternative market like the Micro Emini.
EURUSD Forex market trading strategies
EURUSD Forex daily chart

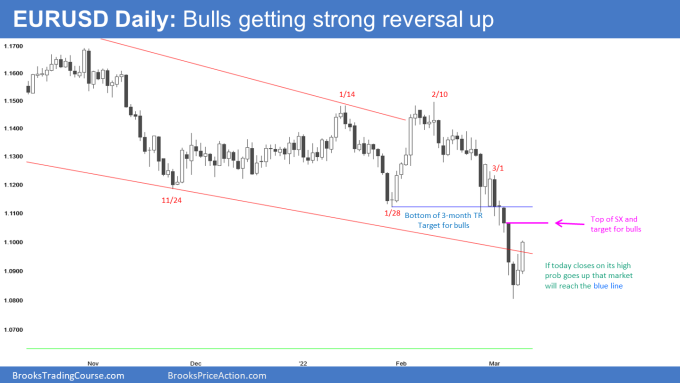
- At the moment, the EURUSD has two consecutive bull bars on the daily chart following an 11-bar bear micro channel.
- The odds still favor a minor reversal up and a second leg down.
- The bulls need to do more to convince traders that they have taken control.
- It is important to mention that the second leg down maybe a retest of Monday’s bear close. This means the second leg down does not have to go down far to form a double bottom and give the bulls a reason to buy for a swing.
- The market is reversing back into the bear channel after the bear breakout below.
- Is today strong enough to reverse the recent three consecutive bear bars? Assuming today will close on its high, it will damage the bear case; however, the bulls will likely need more before traders are willing to buy aggressively.
- The channel down from February 10 was tight. It had several buy climaxes, which are partially why the market is bouncing here.
- Since the market went sideways for 3 months, there will be many bulls who bought the bear breakout of the 3-month trading range, confident they could make a profit or avoid a loss if they used a wide stop and scaled in. This means some of those scale-in bulls will use any bounce to exit the trade breakeven.
- Some bears sold the close of Monday, and they may be willing to scale in. Those bears may be disappointed here and look to buy back shorts on any pullback.
- Overall, the EURUSD will probably go sideways over the next several days.
- If the bulls get a strong bull close today and another bull close tomorrow, the odds will increase for the bulls, and the bears may give up.
Summary of today’s S&P Emini futures price action and what to expect tomorrow

Al created the SP500 Emini charts.
End of day summary
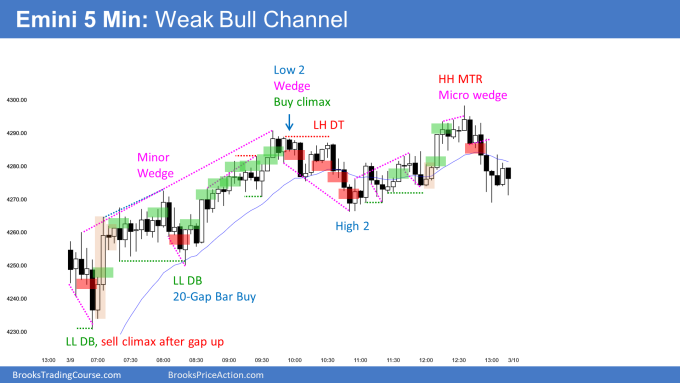
- Today was a large gap up, which means the odds favored a sideways test of the moving average.
- The bears tried for a trend from the open on bars 1 and 3; however, they failed on bars 6.
- The bulls bought aggressively on bar 7; however, bulls were not eager to buy at a new high of the day above bar (a sign of trading range trading).
- Bars 8-10 were overlapping and had bad follow-through. This means traders would begin assessing the strength of this pullback on bar 8 and deciding if the bulls would get a second leg up or the bears would get the reversal down.
- Bar 21, the market was almost neutral; however, it was probably always in long since the market was above the moving average and the bulls had the breakout bar 7.
- Bar 22 is a reasonable double bottom stop entry buy at the moving average; however, it forced traders to buy in the middle of a trading range, so the probability is not high.
- Today was a weak bull channel that mainly was a trading range day.
- If you take away bar 7 and bar 68, all of the other bars were overlapping, limiting order market and scalping.
- The bulls had such a large gap on the open that the odds were they would be exhausted, which is why the odds favored a trading range day today.
See the weekly update for a discussion of the price action on the weekly chart and for what to expect going into next week.
Trading Room
Traders can see the end of the day bar-by-bar price action report by signing up for free at BrooksPriceAction.com. I talk about the detailed S&P Emini futures price action real-time throughout the day in the BrooksPriceAction.com on trading room days. We offer a 2 day free trial.
Charts use Pacific Time
When I mention time, it is USA Pacific Time. The Emini day session charts begin at 6:30 am PT and end at 1:15 pm PT which is 15 minutes after the NYSE closes. You can read background information on the market reports on the Market Update page.


Isn’t shorting below bar 3 taking a trade in the middle of the trading range? I’m curious why it was marked.
Also, is shorting below bar 15 a good idea? If not, could you explain why? One possible reason I can think of is the tails at the bottom of the prior bars, which indicates buyers below.
Bar 3 is a second entry short on the open. It is possible it would have been the high of the day
and the start of a trend from the open. While it is in the middle of the trading range, the range is small and likely to more than double so the risk-reward is strong but probably is low.
Bar 15 is reasonable for bulls to exit below, but it is after bar 6-7 bull bars. The problem with bar 15 short is risk-reward. It is a tight trading range which is not a good environment for stop entries. Also in situations like bar 15 traders who sell below, it will often sell higher like the high of bar 14 and get out breakeven.
Thanks Brad for the report and detailed work as always! Question to Al (tried to place it in the room yesterday but for me the question box has not been opened): In the 2022 stock video market you have mentioned that over time all/most markets work higher and for long term investment it is recommended considering buying markets ETF’s. Could you please highlight which ETFs are you referring to but most importantly is it the right timing doing so regardless if the market will make a new low or not while in the background the working assumption the market will go sideway for a decade even if will make a new ATH?
Answering just in case Al does not see this comment*
There are US regulatory problems that can get one in trouble for providing investment advice, so one has to speak more in generalities here.
Overall, Al is saying that the world economy has been growing forever and will likely continue growing. So if you pick any U.S.-based EFT that tracks the S&P or Nasdaq, such as the SPY, and buy significantly scale in lower (dollar-cost averaging), one will make money over the long term.
Investing is a give and a take. On the one hand, one can invest now but risk a deep drawdown and then decide what to do, such as scaling in. The other side is waiting for the deep pullback to buy, but risks are missing out if the market keeps going up.
Thanks
Thanks Brad!
Would the 4th bar after high 2 on the chart be a reasonable low 2? I am talking about the bear bar after the big bull bar. Shouldn’t the continuation of the bear trend be expected?
I am assuming you are talking about bar 4 today.
Today was a gap up and the odds were the market was going to pullback to the moving average before deciding on a rally or reversal of the trend.
You are correct about a high 2 failing which would form a L2, however, it all depends on context. Today the bears got the bar 5 bear breakout, but there was no follow-through.
In general when you have a large gap, if there is going to be a trend it will be in the direction of the gap. But again it depends on context.
Appreciate the reply, however I was talking about bar 56. I took that short and exited after disappointing follow through.
This is amazing analysis. Exactly as you predicted. Truly helpful. I was not aware that this happens each day, else i would be reading this everyday. Please can you let me know by what time do you post these? I am in US EST. So please let me know. Thanks in advance!
Glad it is helpful. These reports are usually posted around 9:20 EST unless otherwise noted.
They are absolutely helpful. I will keep a close eye on your posts going forward. Thanks again!