Monthly S&P500 Emini candle chart: Bear ioi sell setup in buy climax
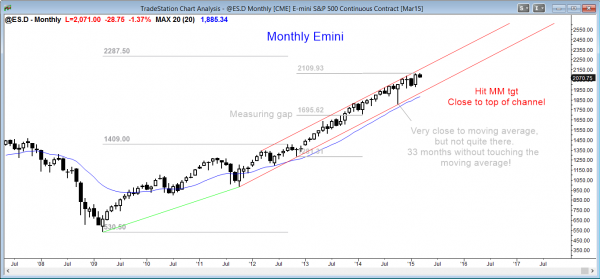
The monthly Emini candle chart has a bear inside bar this month following last month’s outside up bar. If the month stays this way, this month’s candle would be a sell signal bar.
The monthly S&P500 Emini candle chart has not touched the 20 bar exponential moving average in 33 months. I have mentioned this repeatedly because this is extremely unusual. It has happened only twice before in the past 50 years, and those two other times were followed by reversals of at least 20%.
When a chart is in a tight channel for an extremely long time, traders who are continuing to buy become increasingly quick to exit on even a small reversal. Why is that? Because they know that once a correction begins in an overbought market, it can last a long time. As a guide, I use TBTL…Ten Bars, Two Legs. On the monthly chart, this is about a year.
When a trader is buying late in a bull trend, he is hoping for a quick profit. You will sometimes hear this called the greater fool’s theory of the markets. It can be argued that only a fool will pay too high with the hope of finding an even greater fool who is willing to buy his stock from him for an even greater price.
Although most traders buying up here are institutions and not fools, many are momentum traders. As soon as the momentum weakens, they sell out of their longs and will not look to buy again for many bars. Once the momentum stops, they stop buying, and these traders will be quick to sell out of their longs. This means that even a relatively small selloff can make traders who bought during the last few bars (months, since this is a monthly chart) sell and wait to buy. When they sell, they will drive the market down below the entry price of the bulls who bought 4 – 5 months ago. They, then, will sell. They want to avoid losing money, knowing that they bought during an overbought bull trend. This selling can cascade down quickly.
Some bulls will not sell during the first leg down because they do not want to be trapped out of a good position by a brief selloff. However, if that first leg down is big enough, these bulls will decide that it is better to get out and wait many bars before buying again. They want to give the bears time to see if the bears are strong enough to take control of the market. If the bears fail, the bulls will buy back their longs, confident of another leg up. But they need to get out of their positions first, and they will use the first bounce to sell out of their longs with a smaller loss. Their selling contributes to the start of a second leg down.
Bears will also sell that rally once they see a strong first leg, and this also helps create a second leg down. That lower high creates a lower high major trend reversal on smaller time frame charts, like on the daily and weekly charts, and this will attract other sellers. Before long, traders see the market racing to below the most recent major higher low, which is the October low, and it is the target of the selloff once it begins. The monthly moving average is the obvious other target because that is the measure I am using to conclude that the monthly chart is extremely overbought. It will remain that way until it finally touches that moving average.
Has the test down to support begun? It is impossible to know until there has been strong follow-through selling. Everyone will be watching for that over the next couple of weeks.
At the end of the month, if there has been follow-through selling, this month’s candle will be a big bear candle. It would then be a sell signal bar going into next month.
Weekly S&P500 Emini candle chart: Breakout below last week’s sell signal bar
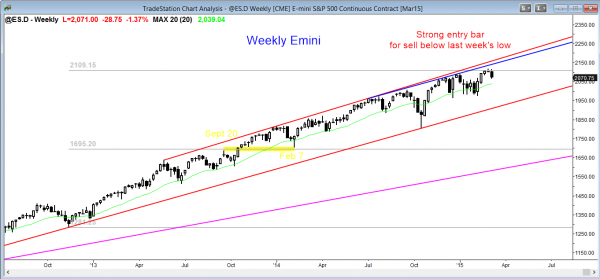
The weekly Emini candle chart had a weak sell signal bar last week, but today’s big selloff created a strong entry bar on the weekly chart. If this continues, targets are the trend lines below, and the most recent higher low, which is the October low.
The weekly S&P500 Emini candle chart had a small doji sell signal bar last week after 4 strong bull trend bars. That is a low probability sell signal. However, the bears compensated for that by creating a strong sell entry bar with today’s selloff. The bears see the trading range of the past few months as the final bull flag. They are looking for TBTL Ten Bars, Two Legs sideways to down to the bottom of the channel.
Unless there are able to create strong follow-through selling next week, this week’s trend reversal will fail. If next week is a bull reversal bar, then it is a buy signal. Traders will see this week and next week as simply a pullback from the 4 week breakout of a 3 month trading range. Since most trend reversals fail, the odds are that next week will disappoint the bears and that the market will continue sideways. However, the context is good for a correction, and traders will therefore be looking to swing trade shorts on the daily chart if the selling continues next week.
Daily S&P500 Emini candle chart: Breakout below trading range
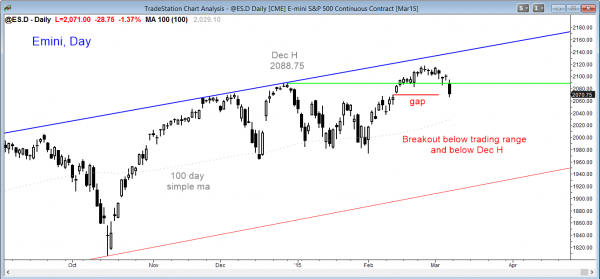
The daily Emini candle chart reversed down strongly and closed a gap on the daily chart
The daily S&P500 Emini candle chart broke below the month long trading range, and the selloff triggered a 60 minute head and shoulders top sell signal. The bears need strong follow-through selling on Monday. If instead there is a bull reversal, then today’s selloff will more likely be just a test of the February 12 gap.
On the other hand, traders learning how to trade the market must understand the importance of follow-through. After a bear breakout like today, the chance of at least a measured move down much higher if the next day, Monday, is also a strong bear trend bar. If it is, then today candle might be a measuring gap, or even a breakaway gap that could lead to a swing down. I use the term “gap” in a broad way, and a trend bar in the right context is a gap. A gap is any space between support and resistance. Today is a gap because today’s close was below yesterday’s low. In fact, today’s close gapped below the lows of the past 14 days.
In any case, nothing has changed. I still believe that there is a 60% chance that the market will correct about 20% at some point this year and fall below the October low. To say that this is the beginning of the selloff is premature. There have been many others and they did not fall far. The reality is that by the time everyone realizes that the bears are strongly in control, the market will be far below where it is now.
That is always the way trend reversals form, and the way it has to be. Once it is clear, the probability is high and the stop is far away, and there is not much profit left. If the bears get high probability of lower prices, the bulls get good risk reward…they have a lot of room to the stop for the bears, and their stop on any long is small. However, the probability is also low. No one ever gets great risk/reward and high probability because no institution would ever take the other side of the trade, and therefor the trade would never happen. The market always has to offer something to both sides. One side gets higher probability and the other get better risk/reward.
Traders can see the end of the day bar-by-bar price action report by signing up for free at BrooksPriceAction.com. I talk about the detailed Emini price action real-time throughout the day in the BrooksPriceAction.com trading room, and a 2 day free trial is available.
When I mention time, it is USA Pacific Standard Time (the Emini day session opens at 6:30 am PST, and closes at 1:15 pm PST). You can read background information on the intraday market reports on the Intraday Market Update page.


