Trading Update: Tuesday March 12, 2024
S&P Emini pre-open market analysis
Emini daily chart
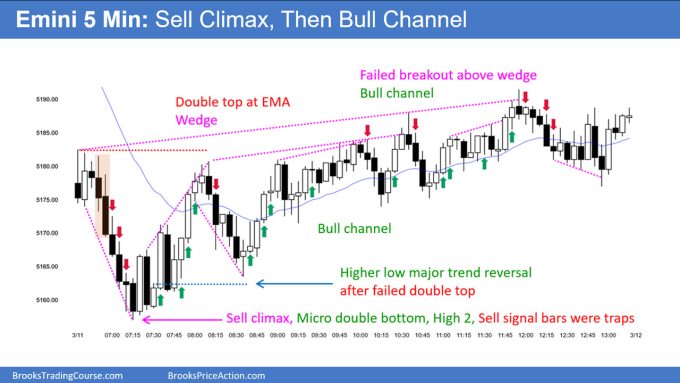
- Yesterday, the Emini formed a High 1 buy signal bar following a strong bear reversal bar late in a bull channel.
- Because of the wedge top with last Friday, the odds favor a two-legged pullback. This increases the odds that there are probably more sellers above yesterday’s high, and the market will likely get a second leg down closer to the moving average.
- The bull channel is still tight with open gaps. The odds favor sideways to up unless the bears can get more selling pressure.
- The bears need to get closes below the moving average to convince traders they are beginning to take control. Even if they get closes below, the odds will favor a trading range more than a bear trend.
- Overall, traders expect sellers above yesterday’s high and at least a small second leg down.
Emini 5-minute chart and what to expect today
- Emini is up 19 points in the overnight Globex session.
- The Globex market recently had a strong reversal up during the 8:30 AM EST report. However, it is currently forming a deep pullback. This will increase the odds of a trading range or bear trend during the U.S. Session.
- Traders should pay attention to yesterday’s high as it will likely be an important magnet today.
- The bears will try and get sellers above, and bulls want a strong close above it, creating a strong entry bar on the daily chart.
- As always, traders should assume that today, there will be a lot of trading range price action on the open. Most traders should consider not trading for the first 6-12 bars on the open.
Yesterday’s Emini setups

Al created the SP500 Emini charts.
Here are reasonable stop entry setups from yesterday. I show each buy entry bar with a green arrow and each sell entry bar with a red arrow. Buyers of both the Brooks Trading Course and Encyclopedia of Chart Patterns have access to a near 4-year library of more detailed explanations of swing trade setups (see Online Course/BTC Daily Setups). Encyclopedia members get current daily charts added to Encyclopedia.
My goal with these charts is to present an Always In perspective. If a trader was trying to be Always In or nearly Always In a position all day, and he was not currently in the market, these entries would be logical times for him to enter. These therefore are swing entries.
It is important to understand that most swing setups do not lead to swing trades. As soon as traders are disappointed, many exit. Those who exit prefer to get out with a small profit (scalp), but often have to exit with a small loss.
If the risk is too big for your account, you should wait for trades with less risk or trade an alternative market like the Micro Emini.
EURUSD Forex market trading strategies
EURUSD Forex daily chart

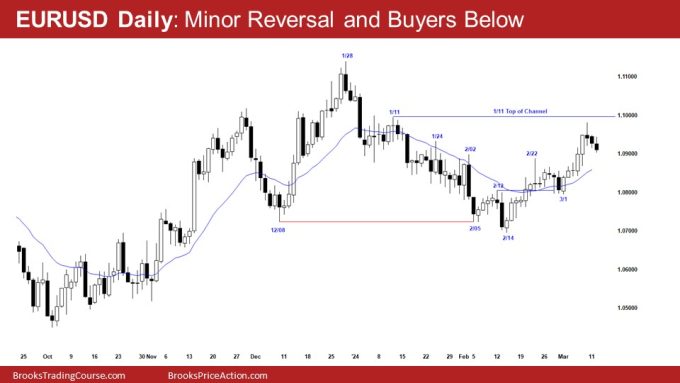
- The EURUSD formed an upside breakout last week and is trying to get an endless pullback.
- Even if today is a third consecutive bear bar, the odds favor a minor reversal and sideways rather than a bear trend.
- The January 11th top of the bear channel is within reach. That increases the risk that there are buyers not far below yesterday and that the market will have to reach the January 11th high.
- As strong as the rally is up to the March 8th high, it stalled just under important resistance at the January 11th high. That is a warning that the rally up to March 8th may be a buy vacuum test of resistance rather than the start of a strong bull trend.
Summary of today’s S&P Emini price action

Al created the SP500 Emini charts.
End of day video review
End Of Day Review will be presented in the Trading Room today. See below for details on how to sign up.
See the weekly update for a discussion of the price action on the weekly chart and for what to expect going into next week.
Trading Room
Al Brooks and other presenters talk about the detailed Emini price action real-time each day in the BrooksPriceAction.com trading room days. We offer a 2 day free trial.
Charts use Pacific Time
When times are mentioned, it is USA Pacific Time. The Emini day session charts begin at 6:30 am PT and end at 1:15 pm PT which is 15 minutes after the NYSE closes. You can read background information on the market reports on the Market Update page.


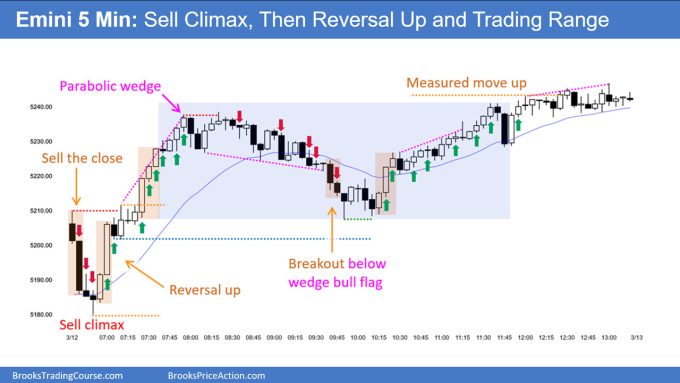
Question. Why short below bar 1? I know we gapped up and have room to the MA. Just looking for some insights on this. Thanks in advance.
You answered your own question. Bar 1 was a strong bear bar with enough room to the EMA for a good Trader’s Equation.
I didn’t think about it like that but you just made me realize that 2 to 1 risk to reward was possible. You made me realize a few things which will help me. Thank you for that!
Hi there, I have one question about Summary of today’s S&P Emini price action. Is it okay to sell below bar 73 as the signal bar for a wedge ?
The wedge that I am referring is formed by the top of bar 61, top of bar 66 and top of bar 72.
Thank You !!!
Taking a wedge reversal means taking a swing trade and by bar 73 it is too late to allow enough time for a swing trade. I also think the setup is far from ideal. The market is AIL and holding well above the EMA. If it was earlier, it would be better to wait for a bear breakout and AIS before taking a short trade.
In the past Al Brooks has said that a good strategy is to take trades like the ones marked on the end of day charts and go for 2 points, with a stop below the signal bar. Does this still hold true? Does a target of 5 points or a different amount make more sense now? Any other nuances that should be address?
2 points is really a scalp not a swing and I think you should be going for bigger profits to maintain good profitability. Ideally you would use price action to exit a swing trade rather than an arbitrary number of points. Al has said many times that swings often turn into scalps because the price action requires early exit.
greatest bull market ever – lets get some upside targets – 7400?
how do the institutions make money as sellers when there are no longer pullbacks?