Market Overview: S&P 500 Emini Futures
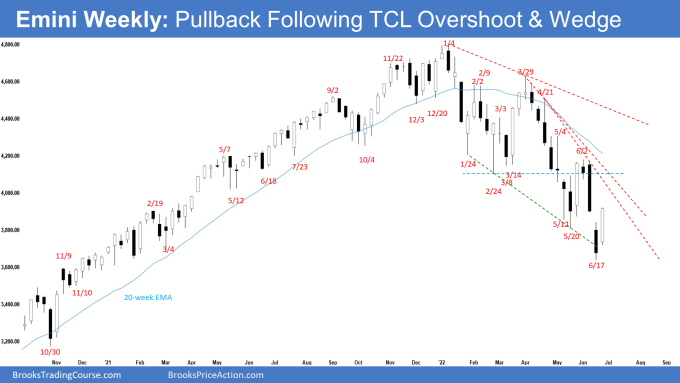
The S&P 500 Emini reversed higher from trend channel line overshoot and a wedge bottom. The bears failed to create follow-through selling below May low on the weekly chart. The bulls want a reversal higher from a trend channel line overshoot and a wedge bottom. The bulls will need to create follow-through buying next week to convince traders that a reversal higher may be underway.
S&P500 Emini futures
The Weekly S&P 500 Emini chart

- This week’s Emini candlestick was a bull bar closing near the high. It closed the gap from last week.
- Last week, we said that odds slightly favor sideways to down for the week. The bears want another bear bar closing near the low, while for the bulls a bull reversal bar closing near the high, with a long tail below – even though the Emini may trade slightly lower first.
- This week gapped higher at the open and continued to trade higher for the rest of the week.
- The bulls want a failed breakout below the May low.
- They see a trend channel line overshoot, and a wedge bottom (Feb 24, May 20 and June 17).
- Since this week was a bull bar closing near the high, it is a good buy signal bar for next week. It may even gap up on Monday, but small gaps usually close early.
- The bulls need to create a consecutive bull bar next week to convince traders that a reversal higher may be underway.
- Bears want a continuation of the measured move down to 3600 or lower around 3450, based on the height of the 12-month trading range starting from May 2021.
- However, they failed to get follow-through selling following last week’s breakout below May low.
- They hope that the current pullback will stall around or below the June 2 high, or the bear trend line and reverse lower from a double top bear flag.
- This week’s candlestick is a weak sell signal bar. Odds are they will be buyers below.
- We have said that the trend channel line overshoot increases the odds of a 2-legged sideways to up pullback beginning within 1 to 3 weeks. The pullback phase may have begun this week.
- With this week closing near the high, the odds are next week should trade at least slightly higher.
- Traders will be monitoring if the bulls get a consecutive bull bar (follow-through buying), something they have failed to do since April.
- If the bulls get that, the odds of a test of the June 2 high and the 20-week exponential moving average increases.
The Daily S&P 500 Emini chart

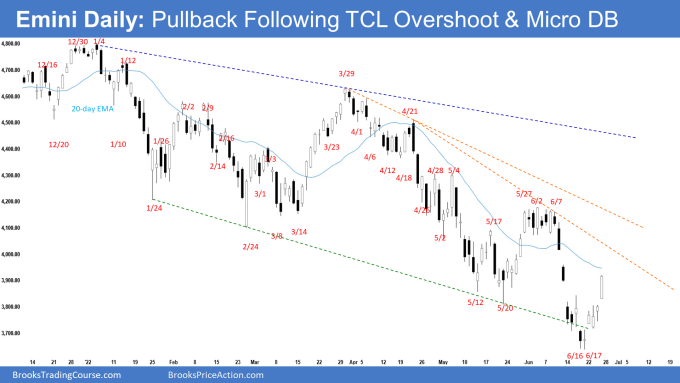
- The Emini gapped up on Monday and continue to trade higher with 4 consecutive bull bars for the rest of the week closing near the week’s high.
- Last week, we said that odds slightly favor sideways to down and at least a small second leg sideways to down after a slightly larger pullback.
- However, because the selling is climactic with a trend channel line overshoot, traders should be prepared for at least a small 2-legged sideways to up pullback to begin within 1 to 3 weeks.
- This week traded higher for the whole week. The pullback phase may have begun.
- The bulls want a failed breakout below the May low.
- They want a reversal higher from a micro double bottom following a trend channel line overshoot and a wedge bottom (Feb 24, May 20 and June 17).
- This week’s move up was strong enough for traders to expect at least a small second leg sideways to up.
- The next targets for the bulls are the 20-day exponential moving average, the bear trend line and the June 2 high.
- The bulls need to trade far above the June 2 high to convince traders that the correction since January may be ending.
- Bears want a continuation of the measured move down to around 3600 based on the height of the 9-month trading range or lower around 3450 based on the height of the 12-month trading range starting with May 2021.
- However, they were not able to create sustained follow-through selling below May low.
- Bears hope that this week was simply another pullback and wants the Emini to stall at one of the resistances above.
- If the Emini trades higher, but stalls around the 20-day exponential moving average, the bear trend line or the June 2 high, odds are the bears will return to sell the double top bear flag for a retest of the low.
- For now, odds slightly favor sideways to up for next week. The move up is strong enough for traders to expect at least a small second leg sideways to up after a slight pullback.
Trading room
Traders can see the end of the day bar-by-bar price action report by signing up for free at BrooksPriceAction.com. Al talks about the detailed Emini price action real-time throughout the day in the BrooksPriceAction.com trading room. We offer a 2 day free trial.
Market analysis reports archive
You can access all weekend reports on the Market Analysis page.


Thanks Andrew for your great and comprehensive report. On daily chart, how likely a bullish MM is underway based upon the 6/17 low to 6/15 high? It may take us to the 4050 area that is the bear trend line based from 4/21 to 6/7.
Dear Eli, a good day to you..
hmm.. a good question..
A couple of resistance ahead, especially the bear trend line.. but 4050 is not really that far away.. I wouldn’t be surprise if it touches it..
It is important that the bulls get some follow-through this week.. they haven’t been getting that since April..
If they fail yet again to get follow-through for the week, that wouldn’t be a good bullish sign..
Alright, let’s monitor how the market unfolds this week..
Have a great week ahead!
Best Regards,
Andrew
Just heard Al’s recorded video from Friday mentioning such MM as a valid scenario…
Dear Eli,
Alright got it.. thanks for sharing..
Did he use 6/17 low to 6/15 high for the MM?
Thanks..
Best Regards,
Andrew
Hey Andrew, yes.
Alright got it, thanks..
Thanks again Andrew for this insightful report! The 20EMA puzzles me still, to my knowledge the line you utilize corresponds with the simple MA (several EMA’s in Tradingview has been transcended yesterday by 20 points (SPX, so only market hours)). Am I missing something?
Thanks in advance, and I enjoy/appreciate your analyses a lot!
All best
Dear Sybren,
A good day to you.
You are right! I had the SMA there instead and not the EMA.
I will correct the chart this week if I have the time.
Thanks for noticing it. Have a wonderful week ahead.
Best Regards,
Andrew
Fridays price action was quite good for the bulls but I wonder if the 3/29 to 5/20 move was big enough to reset the wedge count?
I think it probably did, especially when we are getting a buy signal above a bear bar near the bottom of the channel on the weekly chart, so we will probably get at least another leg down. This is a H4/H5 complex bottom attempt in a broad bear channel where bulls are making money buying at new lows. Whereas, bears are frequently losing control of the market with bulls getting strong bull bars. I think we might be due for 2 legs sideways to up soon if the 6/2 high does not turn out to be a BO test. Dr. Brooks also mentioned that the markets will probably trade up in the second half of the year, we are very close to the second half now.
Dear Andrew and Abir,
A good day to both of you..
Regarding the 3/29 to 5/20 leg down, is quite similar in length of time and range with the 1st leg down from Jan to Feb (1/4 to 2/24).
This 3rd leg down lasted around 7 or so days only.. while the leg down is strong, it is also a bit suspicious in the sense that why it only lasted so short..
With the 1st and 2nd leg down lasting many more days, the bulls must really create strong follow-through buying this week to convince traders that a reversal may be underway.
Otherwise, if it stalls just slightly higher or around current levels, another second leg sideways to down to complete the length of time to roughly the same as the first 2 legs is possible..
Whether we get strong follow-through buying this week is key..
Alright, have a blessed week ahead to both of you.. let’s monitor how the market unfolds this week..
Take care!
Best Regards,
Andrew
Good day, Andrew! Thanks for sharing your inputs. Hope you have a great week and take care as well!
Thank you very much! Your analysis is helpful! But would you please write some about usoil? Thank you!
Dear James,
A good day to you.
Thank you for going through the report.
I think a report for Crude is in the works..
Richard will probably announce it in the future.. do you trade the crude oil market a lot?
So far the 20ema remain a support on the weekly chart.. will see if it the bears can break below it in the next 1-2 weeks..
Take care and have a great week ahead!
Best Regards,
Andrew
Thank you very much! I am trading usoil now. Thank you for your proposal, I will notice it and looking forward to read report for Crude!