Weekend report co-author Andrew A.
Market Overview: Weekend Market Analysis
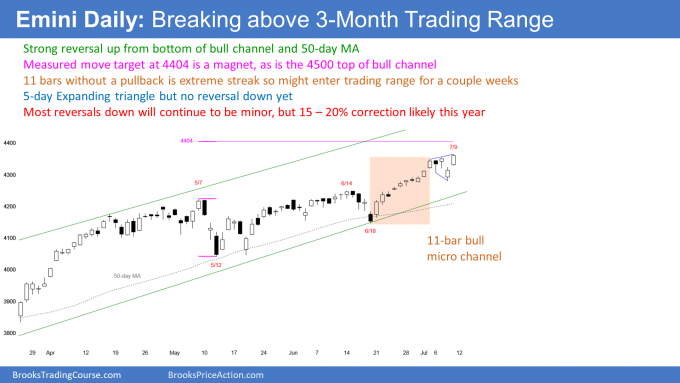
SP500 Emini rallying to channel top after a brief pullback on Thursday. It is trading just under the 4404 measured move target with the 4500 trend channel line a magnet above. Might transition into trading range for a week or two after the streak of 11 days without a pullback ended this week.
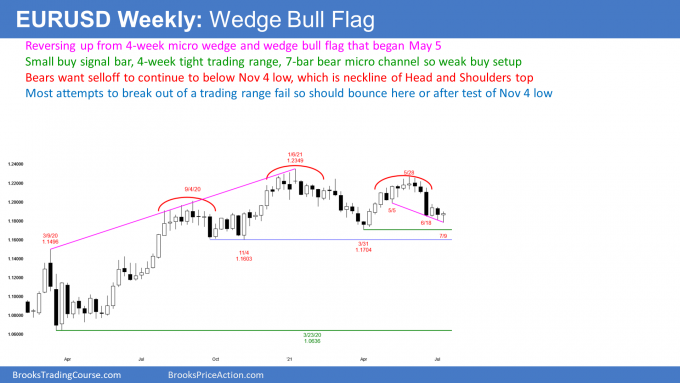
The EURUSD Forex market is reversing up from a wedge bull flag, but there is a 7-bar bear micro channel. Also, it has been in a trading range for 4 weeks and this week is only a small bull doji buy signal bar. This so far is a weak lower low double bottom buy signal bar. If there is a bounce, it might form a small double top bear flag with the June 25th high.
EURUSD Forex market
The EURUSD weekly chart

- The EURUSD market reversed higher this week after testing the neckline of the Head & Shoulders Top, and it closed as a small bull bar with a long tail below.
- The long tail below indicates that there are more buyers than sellers below the prior week’s low.
- There is a wedge bull flag that started on May 5th. This week is the buy signal bar.
- However, it has been in a tight trading range with many overlapping bars for 4 weeks. Also, there is a 7-bar bear microchannel. Therefore, it is a weak bull setup, which makes a minor reversal up more likely than a bull trend.
- If next week trades above this week’s high, the EURUSD could move up to test the June 25th high around 1.1975, potentially forming a double top bear flag.
- Because of the 7-bar bear microchannel, odds are the first bounce will likely be sold.
- The yearlong trading range will likely continue.
- Should the EURUSD break below the Mar 21 and Nov 20 lows, odds are it will reverse back into the trading range again. Most attempts to break out of a trading range fail.
- The bears want a break below the neckline of the Head & Shoulders top. The bigger the breakout bar, the more it closes on its low, and the more bear follow-through bars, the more likely the breakout will lead to a measured move down.
- Until there is a strong and credible breakout from this yearlong trading range, traders will bet on reversals.
S&P500 Emini futures
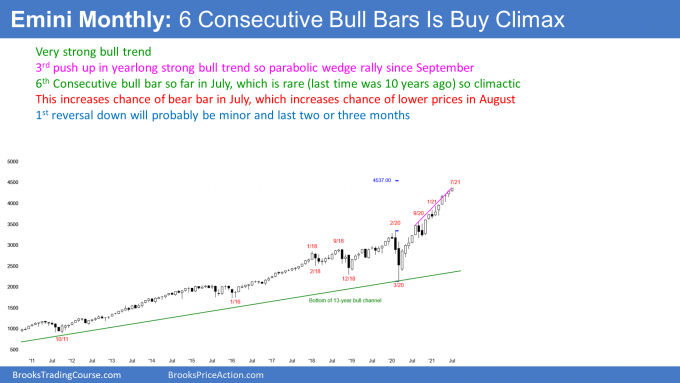
The Monthly Emini chart

- July currently is a small bull bar trading at all-time highs.
- The is a 3rd push up in a tight bull channel since the pandemic lows. The rally therefore is a parabolic wedge buy climax, which often attracts profit takers.
- July is the 6th consecutive bull bar, which is extreme. The last time we had 6 consecutive bull bars was in 2011. This increases the chance that July will close below the open of the month.
- If there is a big bear bar closing near its low, it would increase the chance of 2-3 months of a sideways to down move.
- However, because rally has been in a tight bull channel, bulls will buy the pullback, even if it is 20%.
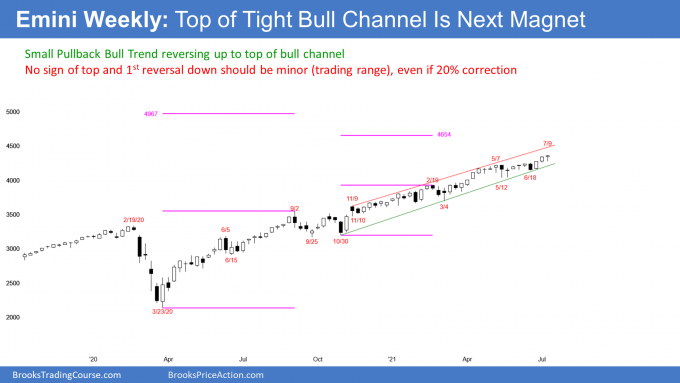
The Weekly S&P500 Emini futures chart

- The weekly bar was a small bull bar at a new high with a big tail below.
- The tail below indicates bulls bought the test of last week’s low, but the small body indicates a loss of momentum.
- Because the bar closed near its high, next week might gap up. If there is a small gap, it will probably close early in the week because small gaps usually close before the bar closes.
- The top of the trend channel around 4500 is a magnet above.
- The Emini has been in a small pullback trend since the pandemic low. This is a very strong bull trend.
- A small pullback trend ends when there is a bigger pullback. The largest pullback since the trend started was in September, which was 10% and lasted 2 months.
- A small pullback bull trend ends with a big pullback. It would then probably be 10 – 20% and last at least 2 – 3 months.
- Traders should buy the pullback for a test of the highs. The Emini might then either resume the bull trend or reverse down and form a trading range.
- A strong bull trend does not usually turn into a bear trend without first forming a trading range.
- There is a larger measured move up target around 4967 using the pandemic low with the Sept 20 highs. There should be a 15 – 20% pullback before the Emini gets there.
- There is another measured move target around 4654 using the height of the Nov 20 to Feb 21 move.
- If the Emini reaches the top of the trend channel at around 4500, there is a 75% chance of a reversal down to at least the middle of the channel. The reversal down typically begins by the 5th bar with a high above the channel.
- Traders continue to expect higher prices because every potential bear setup has failed.
- Sometimes the bears give up and stop selling. This can lead to an acceleration up. That usually attracts profit taking. When there is a climactic reversal, that last leg up is called a blow-off top.
The Daily S&P500 Emini futures chart

- The 11-bar bull micro channel ended this week when Tuesday traded below Monday’s low.
- Bulls typically buy the first pullback in a bull micro channel, which they did here.
- There is a 5-day expanding triangle, but no reversal yet.
- Traders continue to expect higher prices, but there is often a 5- to 10-bar trading range after a buy climax, like a micro channel. Look at the April bull micro channel as an example.
- The measured move at 4404 and the top of the trend channel line around 4500 are magnets above.
- Since the buy climax is extreme, there should be a 15 to 20% correction before the end of the year. However, traders will not believe it until it is already half over.
- The bulls will continue to buy every 1- to 3-day reversal down, betting that each reversal will fail and lead to a new high.
Trading Room
Traders can see the end of the day bar-by-bar price action report by signing up for free at BrooksPriceAction.com. I talk about the detailed Emini price action real-time throughout the day in the BrooksPriceAction.com trading room. We offer a 2 day free trial.
Weekly Reports Archive
You can access all weekly reports on the Market Analysis page.


Emini weekly measured move targets. Can you clarify what new information changed the measured moves over the past few weeks from 4235 to 4537 to 4967?
I recognize the 4235 target was reached but the weekly is only on bar 3 breakout above the 3 month trading range. I am applying the rule that 80% breakouts fail within around 5 bars so I was not expecting the change in measured move targets to 4537 and again to 4967, assuming the breakout above the 3 month trading range is going to fail around bar 5 (weekly).
Wouldn’t you wait until after bar 5 (end of July/beginning of August) above the 3 month trading range before changing the weekly measured moves higher? Or do breakouts from trading range channel lines have a different probability then from trend channel lines?
Thank you if you have the time to clarify.
There are always many targets, and I only show the ones that are the most important at the moment. All resistance will ultimately fail since the stock market has been in a bull trend on the yearly chart for hundreds of years. However, the market can pull back for several months at any resistance.
80% of breakouts fail when the market is in a trading range, but 80% of reversal attempts in a strong trend also fail. On the weekly chart, the Emini is in a strong trend. That is more important than the small trading ranges along the way. If a trading range grows to 20 or more bars, then the trading range rule becomes more important. If a trading range is only 5 – 10 bars, traders expect it to be a bull flag and not a 50-50 situation.
Good report. Can you do one on Bitcoin?
Well done ‘BTC member’ helping Al with this weeks post. Thank you as always.
Hello, nice to meet you. You’re most welcome..
Well done, nice analysis Al + Andrew on ES – nice bar to bar comments. Would like to see Monthly, and Daily on EURUSD. Also would like to see USDBTC weekly review.