Trading Update: Thursday November 16, 2023
S&P Emini pre-open market analysis
Emini daily chart
- The Emini formed a bear bar yesterday, creating a hesitation bar on the daily chart, following Tuesday’s upside breakout. This increases the odds of a pullback lasting a day or two.
- The bulls expect buyers below any pullback, forming the market to continue the rally. They are hopeful for a test of September 1st, which is the start of the bear channel that ended in late October.
- The risk for the bulls is getting big; many will begin to take partial profits. This increases the odds of a pullback lasting at least a few bars.
- However, any reversal down will likely be minor and lead to a trading range or a bull flag. This means that bulls will probably look to buy any pullback.
- The bears must halt the buying pressure to have a chance at forming a successful reversal. Next, they will need to develop more bear bars closing on their lows. The odds will still favor a trading range even if they accomplish this.
- Overall, the market will probably go sideways for at least a few days.
Emini 5-minute chart and what to expect today
- Emini is down 6 points in the overnight Globex session.
- Traders should expect the market to go sideways on the open and form a trading range. This means that most traders should be patient on the open, and consider not trading for the first 6 -12 bars. Unless they can trade with limit orders and make quick decisions.
- Most traders should focus on catching the opening swing that often begins before the end of the second hour. It is common for the market to form a double top/bottom, or a wedge top/bottom before the opening swing begins. This means traders can wait for one of the above-mentioned patterns to form before placing a trade.
Emini intraday market update
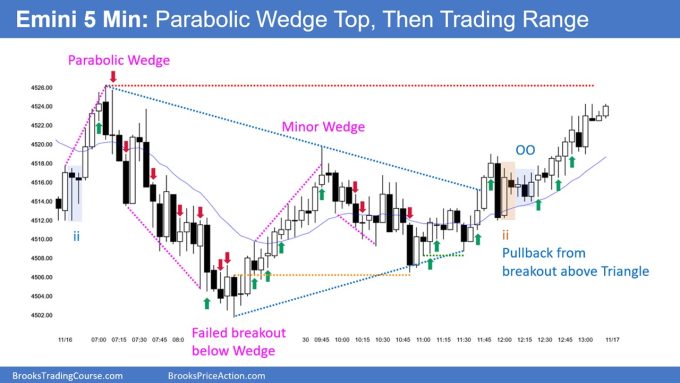
- The Emini rallied and formed a bull trend from the open for the first 6 bars of the day. However, the bulls failed, and the trading range continued.
- The bears sold off down to bar 24 and reversed up near the moving average.
- As of bar 36, the market is Always In Long, and the market will likely get a second leg up.
- Bar 11 was a big bull reversal bar that failed. It was reasonable to buy above bar 11 and scale in lower. This means that the market may rally back up to the 11 high to allow the trapped bulls out.
Yesterday’s Emini setups

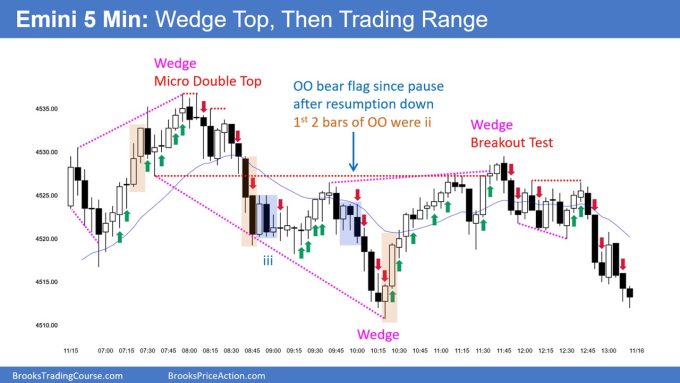
Al created the SP500 Emini charts.
Here are reasonable stop entry setups from yesterday. I show each buy entry bar with a green arrow and each sell entry bar with a red arrow. Buyers of both the Brooks Trading Course and Encyclopedia of Chart Patterns have access to a near 4-year library of more detailed explanations of swing trade setups (see Online Course/BTC Daily Setups). Encyclopedia members get current daily charts added to Encyclopedia.
My goal with these charts is to present an Always In perspective. If a trader was trying to be Always In or nearly Always In a position all day, and he was not currently in the market, these entries would be logical times for him to enter. These therefore are swing entries.
It is important to understand that most swing setups do not lead to swing trades. As soon as traders are disappointed, many exit. Those who exit prefer to get out with a small profit (scalp), but often have to exit with a small loss.
If the risk is too big for your account, you should wait for trades with less risk or trade an alternative market like the Micro Emini.
Summary of today’s S&P Emini price action

Al created the SP500 Emini charts.
End of day video review
See the weekly update for a discussion of the price action on the weekly chart and for what to expect going into next week.
Trading Room
Al Brooks and other presenters talk about the detailed Emini price action real-time each day in the BrooksPriceAction.com trading room days. We offer a 2 day free trial.
Charts use Pacific Time
When times are mentioned, it is USA Pacific Time. The Emini day session charts begin at 6:30 am PT and end at 1:15 pm PT which is 15 minutes after the NYSE closes. You can read background information on the market reports on the Market Update page.


My default mode for ES is it’s in a TR until it proves itself to actually be trending.
Therefore, trades are only limit orders at bottom of bull bars (buy) or top of bear bars (short).
Stop orders should be used in trends, not TR.
The ES is usually a TR market, intraday.
It’s not that easy. You buy below 16. What do you do? You take a 2 points profit? Where is your stop? What about below 50? You need a 5 points stop not to lose. What about selling about 60? Where is your stop?
Never said it was easy. But both trades you mentioned, with proper management are profitable.
Bar 16, scalp buy only. Buy below 16, stop at 4499. Can you tell me why? Also, a scalper is not going to let the stop get hit.
What is a reasonable profit target? Average bar range is slightly less than 6 points, so a bull scalp below a descending EMA would be about half, so 3 points.
Buy below Bar 50 is easier. Get filled on Bar 51, stop 4505. Scale in at close of Bar 52 and set profit target at the first entry (Bar 50 low). Profitable on next bar.
Notice the price action, a lot of traders did exactly that, as Bar 53 was a very profitable scalp from the Bar 50 low buy and scale in on the close of Bar 52.
In a TR, scalp, limit orders and quick exits.
In a trend, stop orders and hold.
i was up 10 points – took the bar 21 stop entry buy which was a wedge bottom reversal at the bottom of a trading range. very reasonable and al confirmed this in the chat room. immediately reversed down on me, i attempted to double down 2×1 at 50% of the height of bar 21. never got within a point of breakeven, instead went down and took me out of everything below bar 21. went from up 10 to down 26 in 10 min. then al suggested reversing short as there were targets below but wait for the bar to close to confirm a decent sell stop entry. i did this and went short below bar 23 looking for a measured move down. well it immediately reversed again and took me out above the stop above bar 21. now down the equivelant of 63 points on the day. trade management seems impossibly elusive doing this … if the suggestion would be just to hold and keep scaling in long below bar 21 where is the termination point? obviously that will work a lot of the time but what about when it doesnt? its only a matter of time before you destroy your account. it is almost daily where these situations arise, youre sailing along making points/money then the losses come fast and furious and pile up in a way theyll never be able to be overcome
Below bar 23 was reasonable to go short, and put an initial stop loss above bar 22. Bar 26 was a H2 however (despite it being a bear bar/doji), followed by an inside bar, which is BO mode. This in combination with the strong bull bar 28 was more than enough reason to cover any shorts, latest above bar 28. (Also consider that the minimum target for the bulls, a MM for bar 28, would already reach beyond your stoploss above bar 22. Why would you want to wait for that to happen?). My 2 cents…
i appreciate the response – youre absolutely correct i couldve and shouldve terminated the short much sooner than i did. but it doesnt change the fact that i’d still have two substantial losses that would never be overcome. price action is amazing for reading the markets and finding great entries all day, but the money management aspect is all that seems to matter and its a huge grey area
Hi Andrew, some tips ahead:
— Money management: risk the same % in every trade. It should not matter that in one trade you lose 20 points and in another one 60 points. Each trade should cost you the same (for example, 0.5%).
— Position management: ¿are you a beginner? Use beginner entries, where trade structure is easy. For example: You have Major Trend Reversals, Opening Reversals, DT/DB or WT/WB during the Open. With these strategies, when you are wrong, you get stopped out quickly because stop loss is normally just 1 bar away from your entry point. Or you can find your setup to enter with a limit order during a pullback when good context (same philosophy, find a +40% probability trade with a good risk:reward ratio). Lastly: Take partials profits. I normally split the position in 3 parts: profit at 1:1 (or scalp profit), another at 2:1 and the last one at 3:1 or 4:1 (or even trail stop loss). After 1:1 (or scalp profit) my full position is breakeven. Locking profits was my single best trading decision ever.
I hope this helps.
Josep
Hi Andrew,
Are you already consistently profitable and just had a particularly bad day? It happens.
If not you should not be scaling in. We do not know how far a move can go and if driven by big money players, as they often are, we cannot compete with their accounts.
Also, the trading room is not a signals service and should not be used to follow trade setup commentary. Difficult I know but we need to maintain strict independence and make our own decisions. Listening to another is a distraction so treat it as education and trade very small if wanting to follow along.
Thank you for all your hard work Brad!! Curious how bar 21 or 22 are not buy entries on the chart above given you have a strong bull bar at the EMA, that was testing the breakout point, with follow through, after a wedge top that had a 2 legged pull back to the EMA.
Apologies, meant to make the comment a question. If anyone could give feedback as to why bar 21 or 22 were not buy signals, that would be greatly appreciated!
Hi Rob,
As I see the chart image, bar 23 is marked as a buy entry (green arrow), therefore b22 is the buy signal.
My apologies for the confusion, I was talking about yesterday’s chart