Market Overview: S&P 500 Emini Futures
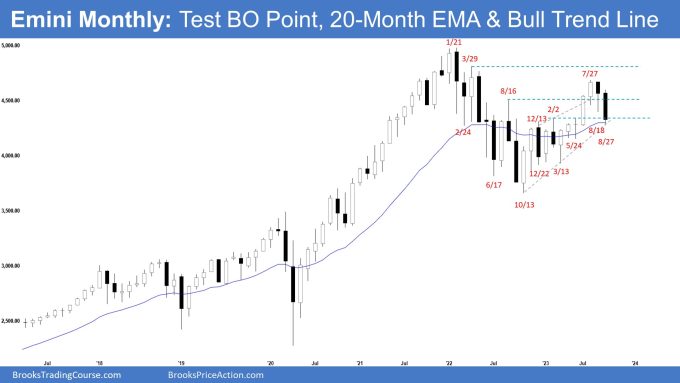
The monthly chart formed an Emini pullback within a broad bull channel testing the 20-month exponential moving average and the bull trend line. The bulls see the market as still being in a broad bull channel and want a reversal to retest the July 27 high. The bears got the first pair of consecutive bear bars since last year (Sept 2022). They will need to create more follow-through selling closing far below the 20-month EMA to increase the odds of a reversal down.
S&P500 Emini futures
The Monthly Emini chart

- The September monthly Emini candlestick was a big bear bar closing near its low.
- Last month, we said until the bears can create strong bear bars with follow-through selling, odds slightly favor the market to still be in Always In Long.
- The bears managed to get follow-through selling in September testing the 20-month EMA.
- They see the prior rally (Jul 27) as a retest of the all-time high and want a reversal from a lower high major trend reversal.
- September was the first pair of consecutive bear bars since last year (Sept 2022).
- The bears will need to create more follow-through selling closing far below the 20-month EMA to increase the odds of a reversal down.
- Previously, the bulls managed to create a tight bull channel from March to July.
- That increases the odds of at least a small second leg sideways to up after the current pullback.
- They see the pullback in August and September simply as a test of the Feb 2 breakout point, the 20-month EMA and the bull trend line.
- The bulls want the 20-month EMA to hold as support. They see the current move simply as a deep pullback within a broad bull channel.
- They want a retest of the July 27 high followed by a breakout and a test of the all-time high.
- Since September’s candlestick was a bear bar closing near its low, it is a sell signal bar for October.
- The Emini may still trade at least a little lower.
- Traders will see if the bears can create more follow-through selling closing below the 20-month EMA.
- Or will the market trade slightly below the 20-month EMA but reverse to close above it by the end of the month?
- For now, until the bears can create consecutive strong bear bars trading far below the 20-month EMA, odds slightly favor the market to still be in Always In Long.
The Weekly S&P 500 Emini chart

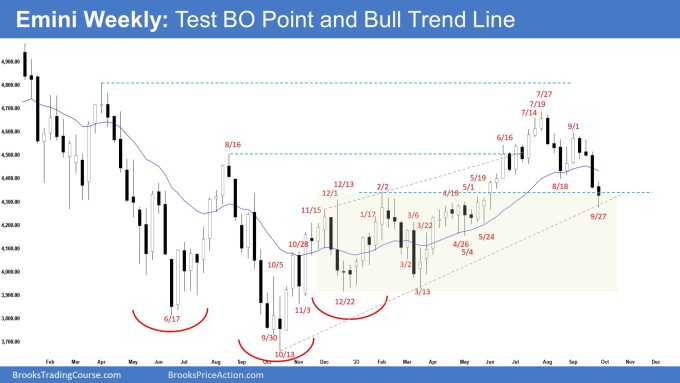
- This week’s Emini candlestick was a bear bar with a long tail below.
- Last week, we said that odds slightly favor the Emini to trade at least a little lower and traders will see if the bears can create follow-through selling or will the market trade slightly lower but reverse up with a long tail below or a bull body.
- This week traded lower but reversed to close with a long tail below, closing around the middle of the candlestick.
- Previously, the bulls got a strong trend up (from March) in a tight bull channel.
- The bulls hope to get a retest of the July 27 high from a double bottom bull flag (Aug 18 and Sept 27).
- They want the Emini to reverse back above the 20-week exponential moving average.
- They see the current move down simply as a deep pullback within a broad bull channel.
- The bears got a two-legged pullback testing the breakout point (Feb 2) and the bull trend line.
- They got follow-through selling this week and a consecutive bear bar below the 20-week EMA.
- They want a strong breakout below the bull trend line with follow-through selling.
- If there is a pullback (bounce), they want another leg down to complete the wedge pattern with the first 2 legs being August 18 and September 27.
- Since this week’s candlestick was a bear bar with a long tail below, it is a sell signal bar for next week albeit weaker.
- Traders will see if the bears can continue creating follow-through selling or will the market stall around the current levels.
- For now, while the Emini could still trade a little lower, odds slightly favor the market to still be Always In Long.
- However, if the bears continue to get consecutive bear bars closing near their lows, that will increase the odds of a reversal down.
Trading room
Al Brooks and other presenters talk about the detailed Emini price action real-time each day in the BrooksPriceAction.com trading room. We offer a 2 day free trial.
Market analysis reports archive
You can access all weekend reports on the Market Analysis page.


Not for nothing, but I love the cat in your profile pic.
Dear Charlie,
Haha.. he’s the eldest among all my cats.. he’s been through thick and thin with me..
Coming to 8 years old now..
Thanks for your comments.. have a blessed weekend ahead..
Best Regards,
Andrew
Thanks Andrew for great report. Thinking loudly if September 27th is the 3rd push down whereby the 1st push down is the start of the last bull leg up toward end of July that have started by July 14th.
Ola Eli,
A good day to you..
I see what you mean.. It could be..
I initially wanted to mark that low in July as the first push down, thereby making it a micro wedge.. but decided against it..
For now, using the most obvious leg to everyone may be better..
Let’s see how the market play out this week..
Have a blessed week ahead Eli..
Best Regards,
Andrew
Dear Mario,
A good day to you..
Sure.. while the pullback is slightly deeper than what the bulls would like it to be, the premise of a bull trend (higher highs, higher lows) is still valid.
The bears will need to show they can break through the support (20-month EMA, Bull Trend line) with follow-through selling..
If the bears can do that, then the market may flip into Always In Short.
That’s why the move down could still be a pullback within a broad bull channel and not the start of a bear trend.. even if the market can still trade at least a little lower..
It is looking through the term of slightly longer time frame outlook..
When will it flip into Always In Short?
Perhaps, if October is a bear bar closing near its low, closing far below both the 20-month EMA and the bull trend line, it could flip the market into Always In Short.
Have a blessed week ahead..
Best Regards,
Andrew
Hi Andrew,
Thanks for the great report on the Emini! Genuinely appreciate your work.
One question, could you elaborate more on what you mean in terms of price action when you mention on the monthly chart “odds slightly favor the market to still be in Always In Long”.
Best regards,
Mario