- Market Overview: Weekend Market Analysis
- 30 year Treasury Bond futures
- Bond futures monthly chart is in a tight trading range after reversing down from an extreme buy climax in March
- Bond futures weekly chart has a triangle
- Bond futures daily chart has a diamond pattern
- EURUSD Forex market
- EURUSD monthly chart has an outside down bar and a double top
- EURUSD weekly chart is turning down from a wedge top
- EURUSD daily chart is breaking below an 8-week trading range
- S&P500 Emini futures
- Monthly Emini chart formed an outside down bar in September at resistance
- Weekly S&P500 Emini futures chart has a weak High 2 buy setup
- Daily S&P500 Emini futures chart has a minor wedge bottom at support
Market Overview: Weekend Market Analysis
The SP500 Emini futures market reversed up from a small wedge bottom this week and it should be sideways to up through the end of the month on Wednesday. After September became an Emini outside down month in a strong bull trend, traders expect September to close above the August low.
The Bond futures market is in a tight trading range on the daily chart. It is in Breakout Mode. Traders at this point should wait for a breakout up or down.
The EURUSD Forex market is reversing down strongly from a wedge top on the weekly chart. It should continue down to below the June 10 high breakout point.
30 year Treasury Bond futures
Bond futures monthly chart is in a tight trading range after reversing down from an extreme buy climax in March
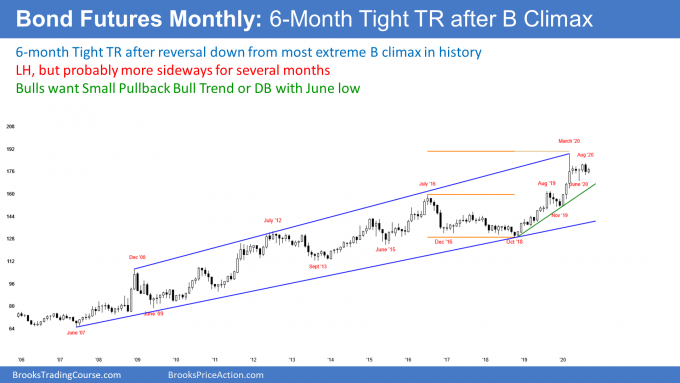
The monthly bond futures chart still has an inside bar in September. An inside bar after an outside bar is an ioi (inside-outside-inside) Breakout Mode pattern. Traders believe that the chance of a bull breakout is the same as for a bear breakout.
There are still 3 trading days left in the month. While it is possible for September to go above or below the August range by the end of the month, it is not likely.
A Breakout Mode pattern always has both a bull and bear setup. The bulls see the trading range as a bull flag in a strong bull trend. For the bears, they see March as the end of the most extreme buy climax in history. They expect the reversal to resume down to the start of the final buy climax, which was the January low.
Bond futures weekly chart has a triangle
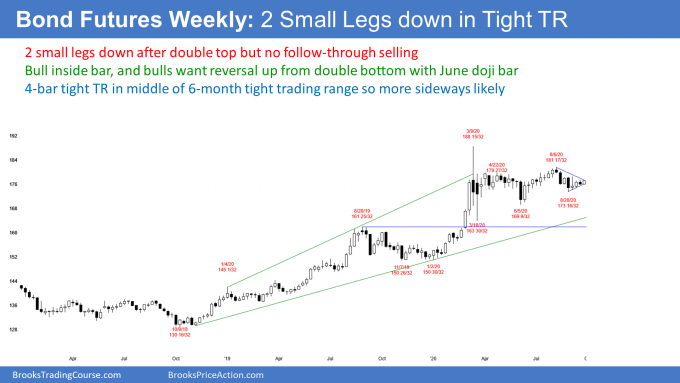
The weekly bond futures market has been in a tight trading range for 6 weeks. It has been in a triangle for 8 weeks.
The range of the bars over the past 3 weeks was small. This is a Breakout Mode pattern, like on the monthly chart. There is an equal chance of a successful breakout up or down. Also, as with any Breakout Mode pattern, there is a 50% chance that the 1st breakout will fail.
For the bulls, they see the past 8 weeks as a pullback from the June rally. For the bears, they see a double top bear flag with the April and August highs. Traders need a clear strong breakout of the range to see which side was right.
Bond futures daily chart has a diamond pattern
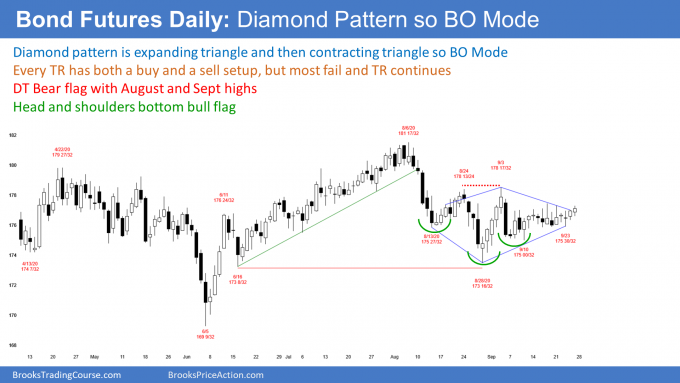
The daily bond futures chart has had a tight trading range for most of September. Like the weekly and monthly charts, this is a Breakout Mode pattern.
Most traders are waiting for the breakout. If there is a big breakout that has 2 or more strong trend bars, it will probably continue for at least a couple weeks. If it reverses within a few bars (days), either the bond futures will go sideways again in the tight trading range or the reversal will lead to a breakout in the opposite direction.
Most traders do not trade when the market is in a tight range. This is because the reward is small relative to the risk, and it requires many quick trades with little profit. A lot of work without much profit. They trade elsewhere while they wait.
The chart is in a diamond pattern. The expanding triangle ended with the August 28 low and the contracting triangle began with the September 3 high.
EURUSD Forex market
EURUSD monthly chart has an outside down bar and a double top
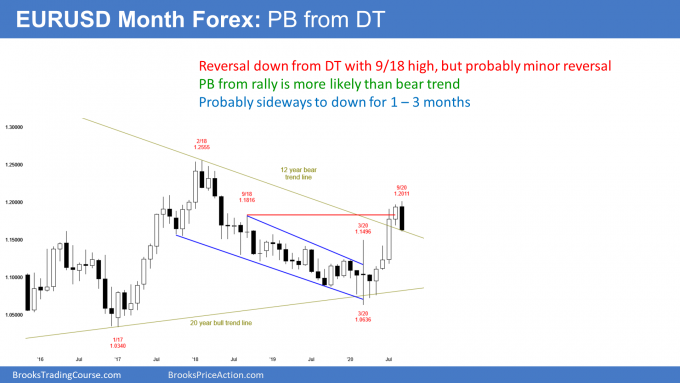
The EURUSD Forex monthly chart in September traded above the August high and then below the August low. September is therefore an outside down month. Since it is at the resistance of the September 2018 high, this is a bearish pattern. There is now a double top. The outside down bar increases the chance of at least slightly lower prices in October.
It is important to note that the rally had 4 strong bull bars. The 1st reversal down from a strong rally is typically minor. It could last a bar (month) or two and dip below the March high breakout point, but traders will look to buy the pullback.
When there is an outside down bar in a strong bull trend, the close of the outside down bar is usually around or above the low of the prior month. Consequently, the bulls will buy into the end of the month as they try to get September to close above the August low. That would reduce the bearishness going into October.
EURUSD weekly chart is turning down from a wedge top
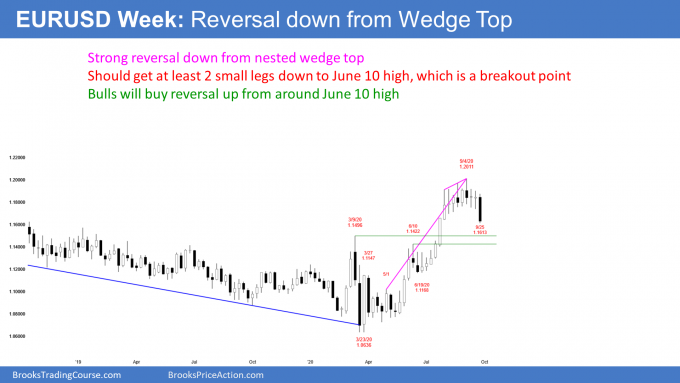
The EURUSD weekly chart broke below the 2 month trading range this week. Additionally, it closed below last week’s low. That increases the chance that there will be lower prices over the next few weeks.
The odds will be higher if next week is a 2nd consecutive bear bar closing on its low. However, since September will probably close around the August low, traders should expect next week to disappoint the bears. If it is a bull reversal bar, traders will conclude that the bear breakout is failing.
What is most likely in the final 3 trading days in September? The EURUSD will probably drift up to the August low and the month will then close a little above or below that low. Traders should expect confusion caused by a follow-through bar that is not clearly bullish or bearish. The breakout below the 8-week range is good for the bears, but the 4-month rally is good for the bulls.
I have been saying for 2 months that the wedge top at the resistance of the September 2018 high should lead to a couple legs down. Also, I said that the pullback should dip below the breakout points, which are the June 10 high of 1.1422 and the March 9 high of 1.1496. Since a pullback in a bull trend is usually not a strong selloff, the test down could continue for several more weeks.
The reversal down might continue down to the June 26 start of the final leg up. However, traders still expect to buy this pullback, even if it reaches that June 26 low.
If the bears get 2 or 3 consecutive big bear bars closing on their lows, traders will begin to wonder if the reversal down is a new bear trend and not just a pullback in a strong bull trend.
EURUSD daily chart is breaking below an 8-week trading range
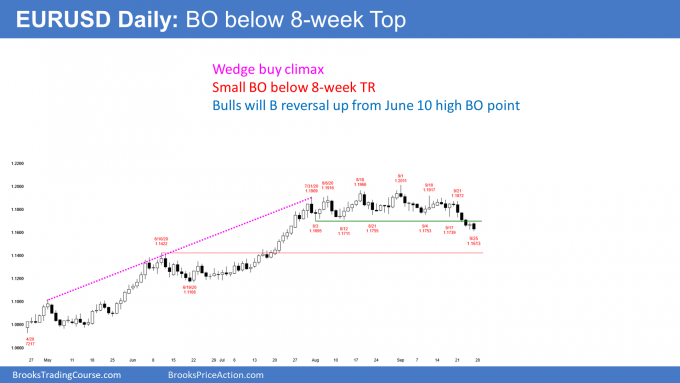
The EURUSD daily chart finally broke below the bottom of the 8-week trading range on Wednesday. Thursday was the follow-through bar, but it had a small bull body.
While this seems unimportant, it is not. Even a tiny bull body is a reminder that the breakout is not as strong as it could have been. It reduces the chance that the selloff is the start of a bear trend and increases the chance that it is going to be just a pullback in this summer’s bull trend.
Can the breakout fail next week? While it is possible, the wedge top on the weekly chart should lead to a couple legs down on that chart. This is currently the 1st leg. This is true even though there have been 2 legs on the daily chart.
Also, breakout points are magnets. This selloff will probably have to test below the June 10 high before bulls will be eager to buy. Until then, rallies might last a few days, but traders will expect at least one more leg down.
What happens if there are a couple big bull bars closing on their highs and back above the September 10 lower high? Traders would conclude that the bull trend is resuming, possibly up to the February 2018 high.
Right now, it is more likely that the EURUSD will work lower over the next couple weeks to at least 1.14. Traders will look to sell 2 – 5 day bounces.
S&P500 Emini futures
Monthly Emini chart formed an outside down bar in September at resistance
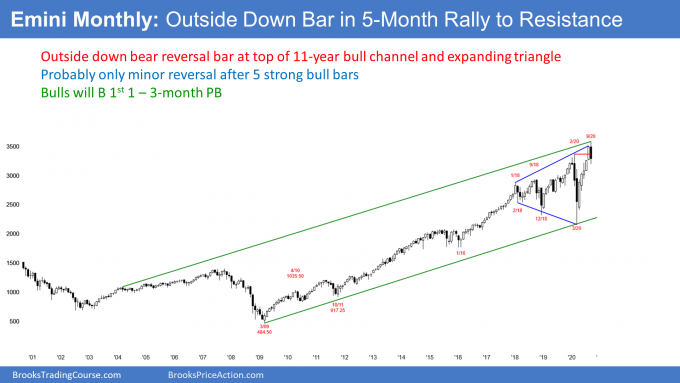
The monthly S&P500 Emini futures chart in September traded above the August high and then below the August low. It is therefore an outside down candlestick. Since it formed at the resistance of the top of a 3 year expanding triangle, it is a sell signal bar.
At the end of August, I wrote that this was a possibility because there was a buy climax at the resistance of the top of the expanding triangle. Also, the past 4 breakouts of the 3-year trading range soon reversed. These reversals created the expanding triangle.
There are 3 trading days remaining in September. When there is an outside down bar in a strong bull trend, the close of the bar tends to be around the low of the prior month. Consequently, the August low will be a magnet for the remainder of September.
More likely than not, September will close above the August low. That would make the candlestick less bearish. However, September will still probably be a bear bar at resistance and closing below its midpoint. That makes it a sell signal bar for October, and traders will expect at least slightly lower prices next month.
Lower prices are likely
How low? The pullback will probably last a bar (month) or two more. It could retrace half of the 5 month rally. If it did, the Emini would fall to around 2867.75, or approximately 2850.
Less likely, the Emini could work off the buy climax by going mostly sideways for a couple months. I have been saying for a month that the odds were that it would fall to 3000 – 3200. It dipped below 3200 this month. It probably will go at least a little lower.
One final thought. Since the extreme buy climax in late 2017, I have been saying that the Emini would probably be sideways for a decade. The top of the range will probably be below 4000 and the bottom of the range might be the March low, but I think it will be lower. This is because decade-long trading ranges typically have at least one 50% correction. Since the top of the range so far is around 3600, a 50% pullback would be around 1800, which is below the March low and the 2000 Big Round Number.
Weekly S&P500 Emini futures chart has a weak High 2 buy setup
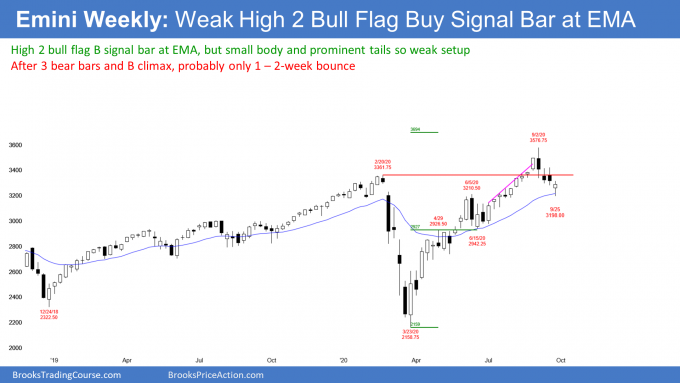
The weekly S&P500 Emini futures chart had 3 consecutive bear bars coming into this past week. That is rare. There has only been one streak of 4 or more bear bars since 2012. That was during the pandemic collapse earlier this year. This is the reason why I said last week that this week would probably close above the open of the week and have a bull body, which it did.
This week is a buy signal bar for next week. It is the 2nd attempt in the past 3 weeks to resume the 5 month bull trend. That makes it a High 2 bull flag buy signal bar.
But after 3 consecutive bear bars, there will probably be sellers not far above this week’s high. Therefore, if the bulls can trigger the buy signal, it will probably just lead to a 1 – 2-week bounce. Traders will continue to expect at least slightly lower prices.
Targets for the bears
The Emini bears have already achieved one goal. They wanted a pullback below the breakout point of the June 5 high. Thursday reversed up from just below that high.
On the weekly chart, there was a trading range in June. A trading range late in a rally is often the Final Bull Flag.
While the rally continued up far above that range, it still could be a magnet. The July/August rally was a bull micro channel, and 8 of the 9 bars had bull bodies. That is unsustainable and climactic.
When there is a reversal down from a buy climax, the bottom of the final leg up is a magnet. That means the Emini might fall to that June 15 low of 2942.
That is just above the 50% correction level of 2867.75. A 50% correction is a common target for a pullback in a bull trend.
Daily S&P500 Emini futures chart has a minor wedge bottom at support
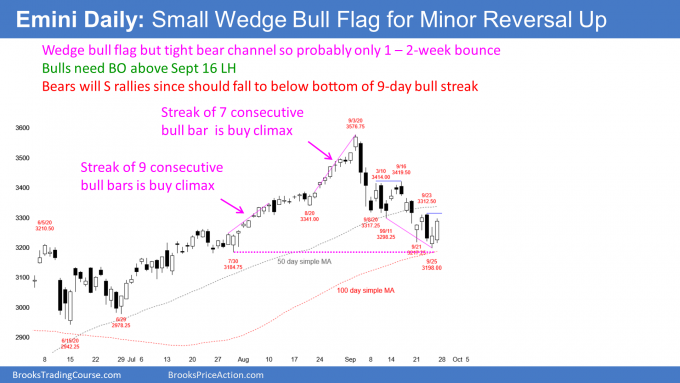
The daily S&P500 Emini futures chart tested several support targets this week and reversed up from a wedge bottom. I have been saying that the minimum target for the selloff was the 3200 Big Round Number, which the Emini reached on Thursday.
Another magnet around that level was the June 5 high of 3210.50. That was the breakout point for the strong July rally. Pullbacks typically test breakout points. That is why I said it was likely that the Emini would test below that high, which it did this week.
Also, this week’s low was just below 3219, which is a 10% drop from the high. When the Emini is at least 10% down, traders use the term “correction” instead of “pullback.”
Additionally, the Emini fell one point below the close of 2019. That means it briefly gave back all of the gains of 2020.
Different computers buy at different support levels. When there is a cluster of support, more computers buy. That increases the chance of a bounce.
Can the selloff become a bear trend?
Can the Emini continue down sharply to my lower targets? Remember, I have been saying for a month that it would fall below the July 30 low of 3184.75. That was the low of a streak of 9 consecutive bull bars. The Emini typically falls below the bottom of extreme streaks. Consequently, the Emini should get there within a couple weeks.
The next targets are the bottom of the June trading range, just below the 3000 Big Round Number, and then a 50% correction down to 2867.75. At the moment, there is a 50% chance that the selloff will reach 3000 and a 40% chance it will fall to the 50% retracement level.
Can it continue down to the March low? There is currently only a 30% chance of that happening before there is a test back up to the September high.
A 10% correction usually leads to lower prices
It is important to note that the Emini fell 10% from the high this week. I have talked about the implications of a 10% correction several times before. A 10% selloff means the market is in a correction and not just a pullback. It usually leads to a bigger correction, and the average is about 20%. A 20% selloff is a bear market. The 20% average is skewed by big drops like the 89% Crash in 1929 and the 70% drop during the 2009 financial crisis. However, the point remains that a 10% correction is usually not the end of a move down.
This is consistent with what I wrote above. At a minimum, the Emini should drop below the bottom of the streak of 9 consecutive bull days that began in late July. There is currently a 40% chance of a move down to below 3000, which would be about a 20% correction.
Goldman Sachs reported that since World War II, the average was 13% and it took an average of 4 months to make a new high. But once it falls 20%, it is in a bear market. The average drop is 30% and lasts 13 months. On average, the reversal back up needs nearly 22 months to make a new high.
The Emini should bounce next week
The selloff was a Spike and Channel Bear Trend. There was a 2 day spike down in early September. Thursday was the 3rd leg down in the wedge bear channel that followed the spike. A wedge often leads to a couple legs up. That increases the chance of a bounce next week.
It is important to note that Wednesday is the final day of the month. I wrote above that the monthly chart should close around and probably above the August low of 3288.25. There is therefore a magnet there, in addition to the support below. Consequently, traders should expect sideways to up trading through Wednesday, with Wednesday probably closing above the August low.
Trading Room
Traders can see the end of the day bar-by-bar price action report by signing up for free at BrooksPriceAction.com. I talk about the detailed Emini price action real-time throughout the day in the BrooksPriceAction.com trading room. We offer a 2 day free trial.
Charts use Pacific Standard Time
When I mention time, it is USA Pacific Standard Time (the Emini day session opens at 6:30 am PST, and closes at 1:15 pm PST). You can read background information on the intraday market reports on the Market Update page.

