- Market Overview: Weekend Market Analysis
- 30 year Treasury Bond futures
- Bond futures monthly chart is in a 6 month tight trading range
- Bond futures daily chart has a double top and a head and shoulders bottom
- EURUSD Forex market
- EURUSD weekly chart has a wedge rally at resistance
- EURUSD daily chart has a head and shoulders top and a triangle bull flag
- Monthly Emini chart could have an outside down candlestick in September
- Weekly S&P500 Emini futures chart working lower after buy climax
- Daily S&P500 Emini futures selling off to 3000 – 3200
- RBG
Market Overview: Weekend Market Analysis
The SP500 Emini futures formed an outside down candlestick week and September might become an outside down month. Traders will sell rallies, expecting the selloff to reach 3,000 – 3,200.
Bond futures are in the middle of a 6 month tight trading range. Traders are looking for reversals every few days.
The EURUSD Forex market has stalled for 7 weeks at the September 2018 high. It is neutral. But because the rally on the weekly chart was climactic and a wedge, the odds slightly favor a pullback instead of a bull breakout.
30 year Treasury Bond futures
Bond futures monthly chart is in a 6 month tight trading range
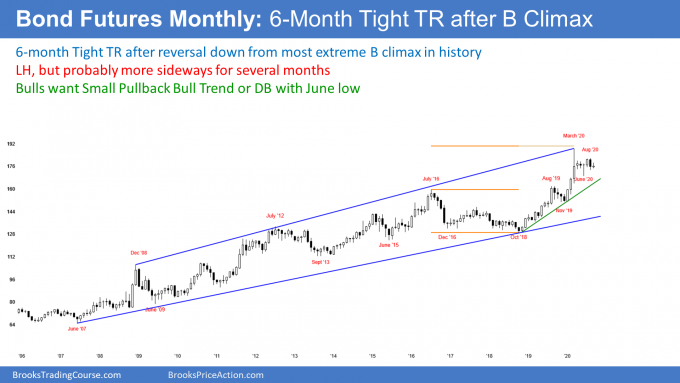
This month’s candlestick on the monthly bond futures chart has a low above last month’s low and a high below last month’s high. It is therefore an inside bar. Last month was an outside bar. There is an ioi (inside-outside-inside) pattern, which is a Breakout Mode setup. If September remains an inside bar, it will be both a buy and a sell signal bar for October. If it continues to have a bull body, traders will be more willing to buy above its high than sell below its low.
The most dramatic 3 month buy climax in history ended in March. The past 6 months have been sideways. Traders are deciding whether the small trading range is a bull flag or a pause on the way down to a bigger correction.
With the 6 bars all overlapping one another, traders see the monthly chart as neutral. There is an equal chance of a bull or bear breakout of the range.
However, most breakouts of tight trading ranges fail. Look at the failed bear breakout in June and the failed bull breakout in July. Therefore, until there is a successful breakout, the most likely path is sideways.
Bond futures daily chart has a double top and a head and shoulders bottom
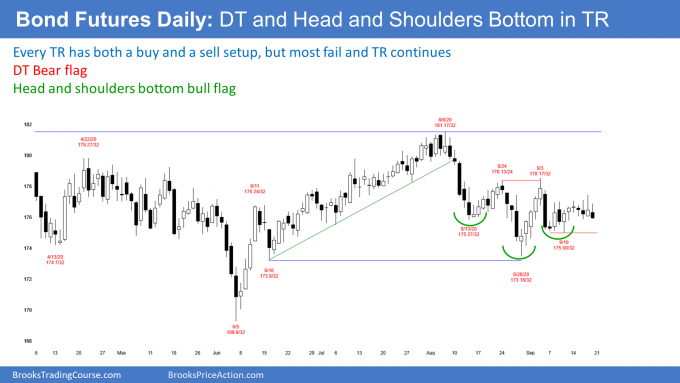
The daily bond futures chart has been sideways for a month. There are lower highs and higher lows. This is a triangle, which is a Breakout Mode pattern.
Traders know that a successful bull breakout is as likely as a successful bear breakout. Furthermore, they know that the 1st breakout of a triangle has a 50% chance of failing.
Also, once there is a successful breakout, the market tends to come back to the apex of the triangle after 10 – 20 bars. Why? Because both the bulls and the bears see the current price as fair. Once bonds break out, traders will wonder if the price is unfair. They usually want to see what happens after testing back to the triangle. Will the 1st breakout resume or will the bond market now break out in the opposite direction?
Until there is a breakout, traders will bet on reversals every few days. For traders to conclude that a breakout will be successful and last 2 or more weeks, they want to see confirmation. That usually means consecutive closes above or below the triangle.
EURUSD Forex market
EURUSD weekly chart has a wedge rally at resistance
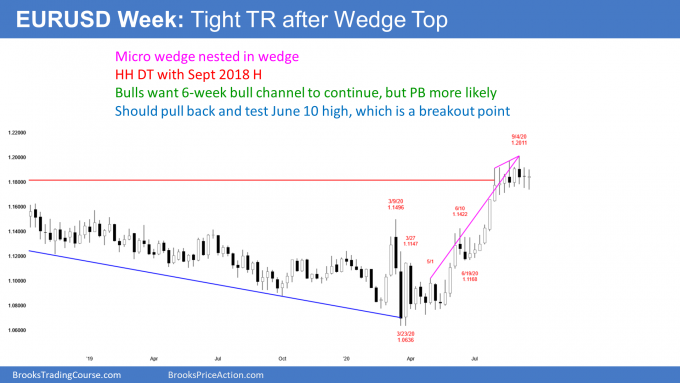
The EURUSD weekly chart has been sideways in a tight range for 7 weeks. Each bar has largely overlapped all of the other bars. This is a Breakout Mode pattern. Traders assume that there is about a 50% chance of a successful bull or bear breakout.
The bulls see the trading range as a bull flag in a 5 month bull trend. They want the EURUSD to break strongly above the resistance of the September 2018 high and continue up to the February 2018 high at around 1.25. That was the end of a strong, yearlong rally and the start of a 2-year bear trend.
The bears know that the rally from the March low has been exceptionally strong. But because it has had 3 clear legs up, it is a wedge bull channel. The bears know that a wedge often attracts profit-taking.
At a minimum, they are looking for a reversal down to the June 10 high, which was the breakout point of the July rally. Markets tend to come back to test breakout points. Traders want to see if the bulls will buy aggressively again at the June 10 high, like they did in July. Or, will there be more sellers than buyers there? If so, traders will expect the pullback to continue down to the next support.
That is the June 26 low. The EURUSD went sideways there for 5 weeks. A small trading range late in a bull trend is often the Final Bull Flag. It is a magnet once the bull trend finally ends.
Less likely, there will be a reversal down from the wedge that retraces the entire rally and possibly breaks below the March low.
What is most likely over the next several weeks?
I said that the probability is about the same for the bulls and the bears. However, a wedge rally to a double top (with the September 2018) high is a reliable pattern. It is probably more important than the momentum up from the March low. Therefore, the bear case and a test of the June 10 high is slightly more likely than another leg up to the February 2018 high.
EURUSD daily chart has a head and shoulders top and a triangle bull flag
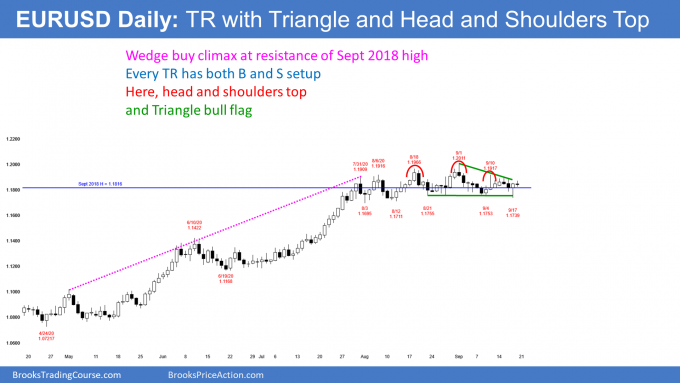
The EURUSD daily chart has been in a tight trading range for 7 weeks. There have been many small legs up and down and minor breakouts up and down. Traders will continue to look for reversals every week or so until there is a clear, strong breakout in either direction.
The bulls got a reversal up on Thursday after a failed breakout below the September 9 low. That low is the neckline of a head and shoulders top with the highs of August 18, September 1, and September 10. Traders expected the breakout to fail because most breakouts fail. Even a perfect head and shoulders top only has a 40% chance of actually leading to a reversal from a bull trend to a bear trend.
Will this reversal up lead to a successful breakout above the trading range? Probably not because, as I said, most breakouts fail. Traders will look for reversals and take quick profits as long as the trading range continues. There is nothing to indicate that a breakout is imminent.
S&P500 Emini futures
Monthly Emini chart could have an outside down candlestick in September
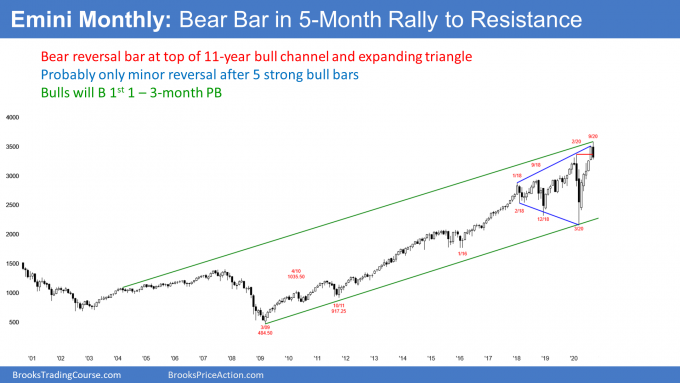
The monthly S&P500 Emini futures chart so far has a bear body in September. There are 8 trading days remaining in the month and the candlestick could look very different on September 30. It could even have a bull body, but that is unlikely.
If September trades below the August low, it would be an outside down month. That would increase the chance of at least slightly lower prices in October. That would probably also close the gap below the August low.
If September does not go outside down, but closes on the low of the month, September would be a sell signal bar for October. Traders would expect a minor reversal down for a month or two.
Minor reversal down likely
The Emini had a dramatic 5-month rally through August. It was strong enough to make traders confident that the current reversal down will be minor. It could last a couple months, but there is only a 30% chance of a strong reversal down to the March low without first forming a trading range.
Trading ranges have legs that go down and legs that go up. Trader believe that the developing selloff will more likely be a leg in what will become a trading range or bull flag than the start of a bear trend. This is true even if the selloff retraces half of the 5-month rally. Traders would need to see 3 consecutive big bear bars closing on their lows before they would believe that there is a reasonable chance of a trend reversal.
3 years into a decade of sideways trading
How high will the bull trend go? Since 2017, I have been saying that the stock market would probably be sideways for a decade between approximately 2000 and 4000. This is because the 2017 rally was the most extreme buy climax in the history of the stock market on the daily, weekly, and monthly charts.
The bulls are hoping that the past 3 years were enough of a pause for the 10 year bull trend to resume. I don’t think so. With the most extreme buy climax in history, the market will probably have to correct like it did in the late 1960’s and after 2000. Both of those corrections lasted about a decade. And both had a least a couple 40% selloffs. In 2009, there was a 58% selloff.
A decade-long trading range is bad for investors but good for traders
While a trading range for 10 years is bad for investors who buy and hold, it is great for traders. If a trader waits for a 20 – 30% correction in the Emini, a stock that he wants to buy that was 100 might now be 60.
A couple years later, the Emini is back at the high at the top of the developing trading range, and his stock is testing its old high at 100. That $40 increase in his stock is a 67% profit in two years.
While this sounds easy, it is virtually impossible to consistently do it. However, if a trader does not catch the exact bottom and top, and buys at 70 and sells 2 years later at 90, he still made 28%. Good for traders.
Weekly S&P500 Emini futures chart working lower after buy climax
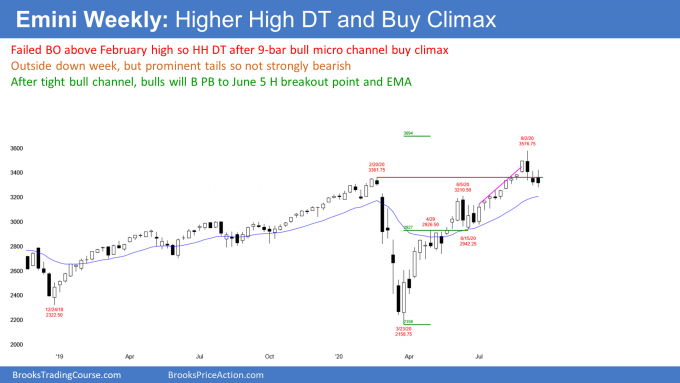
The weekly S&P500 Emini futures chart reversed down 3 weeks ago from the top of a 3 year expanding triangle. The reversal came with an outside down bar. However, that bar had a big tail below and a close above the low of the prior week. Additionally, it was in a 9-bar bull micro channel. The reversal down will therefore likely be minor. A trading range is more likely than a bear trend. That is still true.
Last week traded below the low of that outside down bar. That triggered the weekly sell signal. But instead of a big bear bar closing on its low, the candlestick had a small bear body and prominent tails. That is not how strong bear trends typically begin.
This week traded above last week’s high and then below its low. This is therefore another outside down week. But it closed above last week’s low and it has a prominent tail below.
While traders expect lower prices, all 3 bear bars have prominent tails. That reduces the bearishness of the reversal down. It increases the chance of a 1 – 2 week bounce before the pullback is done.
Bad High 1 bull flag buy signal
Because last week was a pullback in a strong bull trend, it was a High 1 bull flag buy signal bar for this week. But it had a bear body and it followed a bear outside down bar in a buy climax at resistance. That is why I wrote last week that there would probably be more sellers that buyers above the high of the bar.
This week traded above last week’s high and therefore triggered the weekly buy signal. But like I said was likely, there were more sellers than buyers above the bar, and this week quickly reversed down.
I have been saying for several months that the reversal up in March was so strong that traders would buy the 1st pullback. But the pullback could continue for several more weeks. Traders are waiting to buy a credible bottom. However, they know that the Emini might have to fall to below 3000 before it resumes back up.
Cup and handle buy setup likely will form
I have said that a cup and handle buy setup should form within the next couple months. When there is a sell climax, like in March, and then a strong reversal up, traders expect at least a small 2nd leg sideways to up. That means they will buy that 1st pullback.
The March selloff and the 5 month reversal up is the cup. The developing pullback is the handle. The handle can last 20 or more bars and can retrace half of the rally. It could also be brief and shallow. It is too early to tell what it will look like. However, we do know that the bulls are looking to buy the pullback.
After the sharp selloff from an extreme buy climax to resistance, the pullback should have at least a couple small legs down. It could last a couple months. But once the selling dries up and the market goes sideways for a few weeks, the bulls will look to buy above a bull bar closing near its high. They expect a test of the September 2nd all-time high.
Daily S&P500 Emini futures selling off to 3000 – 3200
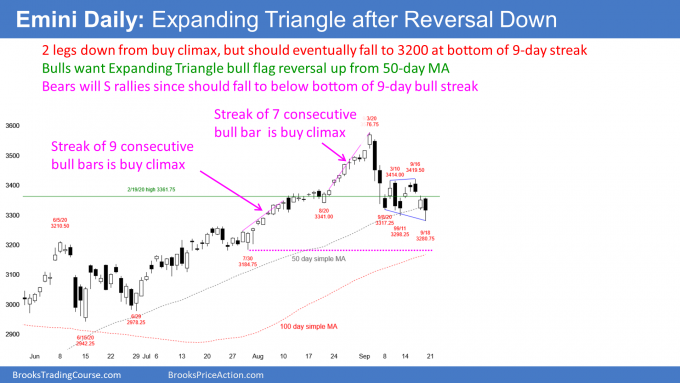
The daily S&P500 Emini futures chart has been sideways for 2 weeks after a sharp reversal down from an extreme buy climax. On Friday, the Emini broke below the range. But it closed back in the range and therefore there is no convincing breakout yet.
There are many ways to decide that a market is in a buy climax. The daily chart has a fairly reliable one. There were 9 consecutive bull trend bars through August 10 and then a second streak of 7 bars through August 28.
Streaks like this usually result in profit-taking and therefore are buy climaxes. For example, the last time there were 9 consecutive bull days was in January 2018. The Emini rallied for a couple more weeks and then reversed down to far below the bottom of the streak.
The current selloff has already dropped below the bottom of the August 28 streak. Traders should expect it to get down to below the bottom of the August 10 streak before there is a new high. The bottom of that streak was the July 20 low of 3184.75, or about 3200. That low is also just below last year’s close. If the Emini gets there, it will have erased all of 2020’s gains.
June trading range might be a Final Bull Flag
There was a trading range in June that came fairly late in the rally from the March low. It is therefore a good candidate for a Final Bull Flag. Its low is therefore a magnet. The June 15 low was 2942.25. That is why I have been saying that it is reasonable to think that the selloff could continue down to 3000.
Also, that is where the extremely tight, 2-month bull channel began. A tight bull channel is a buy climax. Once there is a reversal down from a buy climax, the start of the buy climax is a downside target. This is another reason why the Emini could fall to 3000.
Numbers can be psychological magnets
Markets often get drawn to certain numbers, like the 3000 Big Round Number. That is 18% down from the high. Eighteen percent is close to 20%. Twenty percent is a psychological magnet because if a market falls 20%, it is no longer just in a correction. It is now in a bear market.
Support and resistance are magnets. Like a magnet, the pull is much greater when you get very close. Therefore, if the Emini falls 18%, it will probably continue down to 20%, which is 2861.
That is just below the April 29 high, which was the breakout point for the May rally. Breakout points are also magnets.
Where will the Emini go next?
At the moment, before there is a new high, there is a 60% chance that the Emini will fall to 3200, a 50% chance it will fall to 3000, and a 40% chance it will fall 20% to 2861.
What about the other direction? There is a 40% chance that the Emini will rally to a new high before falling to 3200. However, there is close to a 50% chance that it will reverse up from the bottom of bottom of the 2-week trading range next week as the bulls try to prevent a strong bear close for September.
Remember, the Emini has been in a trading range for 2 weeks. Every trading range has both a reasonable buy and sell setup. In this case, the bears have a double top. The bulls have a possible expanding triangle bull flag, but there is no buy signal bar yet.
Trading ranges are neutral. This one is slightly more bearish because it formed after a reversal down from an extreme buy climax and it has not yet reached important magnets as well.
However, just because you know the destination does not mean you know the path. If you take an airport shuttle from Times Square to JFK, you know you will end up at JFK, but you don’t know how many other stops the van will make before you get there.
A bear breakout is slightly more likely than a bull breakout, but the selloff has not been particularly strong after the 1st 2 big bear days. The Emini might have to go higher to find more aggressive sellers.
But even if it breaks strongly above the 2 week range, it will probably form a lower high at around 3500 and then resume down to the targets below. Therefore, a breakout above the trading range will likely fail to lead to a new high.
RBG
Election turmoil is likely

Supreme Court Justice Ruth Bader Ginsburg (RBG) died on Friday. Her death will affect our election and the stock market.
I have seen several surveys of voters that asked if the voter will vote in person or mail in his ballot. One recent survey found that 89% of republicans will vote in person, but only 45% of democrats will.
If that is even close to accurate, Trump will have a huge majority of popular votes and electoral votes on election night. I assume he will declare that he won the election, fully aware that possibly half of the democrat votes were not yet counted.
Over the next couple weeks, as they get counted, Biden might end up leading Trump by millions of votes. Also, he could even have an electoral landslide victory.
President Trump has been involved in thousands of lawsuits in his life. Who does not think he and his supporters will sue over the results of the election if he loses? The republicans will claim that many of the mail-in votes were fake and came from China. The democrats will claim that republican secretaries of state and governors unlawfully rejected votes from democratic areas.
SCOTUS will be a mess
Since everyone knows there will be claims of fraud on both sides and that there will be lawsuits, this should quickly reach the Supreme Court of the United States (SCOTUS) and it will be resolved before Christmas.
There are now 5 conservatives and only 3 liberals on the court. I am very confident that Chief Justice Roberts, a conservative, and at least one other conservative will do the right thing. They will put the interests of the country ahead of their ideology.
I do not think that the Senate will approve a replacement ahead of the election. I say that because the republican Senate in 2016 blocked Obama’s appointment, claiming it should wait until after the election so that the American people could have a say in who the next justice would be.
The fairness issue will be a problem for swing voters, especially in the suburbs, who will be key to Trump’s chances of re-election. The republicans know that if they approve the new justice before the election, it will cost them votes. It will increase the chance of democrats taking the Senate and Presidency. The republican senators who are at risk of losing know that the risk will increase if they vote to approve the nominee before the new Senate takes control on January 3. Several will likely be unwilling to take that risk.
If there is a vote on Trump’s nominee, I think that at least 4 republicans will go along with the democrats and block the nomination. Three might be the number needed because Arizona said it will seat its new senator on November 30 if the democrat wins.
Let’s say the democrats win the Senate and the White House on November 3. What would happen if the republicans approve Trump’s nominee after November 3 but before the democrats take control of the Senate on January 3? The republicans will be giving President-elect Biden a free pass to increase the number of justices to 13 so that the liberals will control the Court. Remember, the Constitution does not specify that there are 9 justices. We just made that up. The president can nominate as many as he wants and the Senate can approve as many as they want.
The votes will get counted
Chief Justice John Roberts, a conservative, has a strong sense of responsibility and a deep respect for the Constitution. I trust him to do the right thing, and his leadership will decide who the next president will be.
The vote should not be a 4 – 4 tie because the country will be turning to the Court for an answer. Their job is to give a clear answer, and I believe they will. I am confident that Roberts will be able to bring one other conservative with him so that there will be at least 5 votes in favor of counting all of the votes. The Court will conclude that there has to be a very strong reason to not count a vote. The result will be that most votes will get counted.
That does not mean that Biden will win because no one knows which side will have the better turnout. However, it does mean that the election will be fair and it will be decided before January 20.
All of this is great fun for people who enjoy talking politics, but it creates so much negativity that it might be impossible for the stock market to rally much until after the election results are final. Therefore, the Emini will probably be in a trading range through the end of the year.
Trading Room
Traders can see the end of the day bar-by-bar price action report by signing up for free at BrooksPriceAction.com. I talk about the detailed Emini price action real-time throughout the day in the BrooksPriceAction.com trading room. We offer a 2 day free trial.
Charts use Pacific Standard Time
When I mention time, it is USA Pacific Standard Time (the Emini day session opens at 6:30 am PST, and closes at 1:15 pm PST). You can read background information on the intraday market reports on the Market Update page.


Thanks Al for the weekend report, Just to confirm whether is last week’s high at 3424.25. Apparently this week’s high did not trigger the buy signal. By the way I am using TD Ameritrade weekly chart.
Have a nice weekend. 🙂
Although it is difficult to see on the weekly chart above, this week did go above last week’s high and it therefore did trigger the weekly High 1 buy signal. That chart is the continuous chart of the day session.
Thank you Al for your explanation
Thanks Al, I enjoy the trading room immensely.
Since you outlined the concept of destination vesus the path, options of futures seem enticing to me.
I have one question on options on futures. Have you tried trading options on the ES? Do you have any advice to someone who is thinking of doing so?
Yes, I have, but I have traded SPY options forever and they are essentially identical to the Emini options. I spend most of my time in the futures market, trading the Emini. But I like feeling connected to the stock market as well, and SPY is in the stock market sphere.
Both are huge institutional markets and tethered to the S&P and therefore to each other. The result is that they have to move almost exactly the same. Firms would arbitrage them and this prevents them from getting apart for more than a few seconds.
Thanks Al. Great report, as usual.
Appreciate your insight on the election dilemma.
With all the zero commission fees, I’m wondering if you have considered trading the SPY vs Emini?
Zero commissions does not mean free trading. There is still a bid-ask spread. The fill becomes important.
No firm can stay in business unless you are paying them. When I am day trading, every tick matters, especially with scalping. I am concerned about slippage and not getting filled if I traded with a zero commission firm.
I have not tried, but they have to make money from me. If something is good for me, it has to be better for them, which means it is not as good for me as I might have thought.
I am confident that there would be too many trades where something annoys me. I think it is fine for overnight trading, but I am not going to try for day trading because there will be recurring annoyances that do not happen with the Emini.