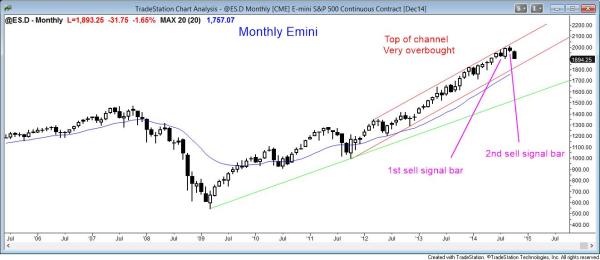
The monthly S&P500 Emini candle is forming a big bear entry bar in an overbought market

The monthly Emini chart triggered a second entry sell signal last week and is now forming a big bear entry bar. However, there is a long time before the monthly bar closes and it might look much different once it does close.
The monthly Emini chart is exceptionally overbought, as I have discussed repeatedly over the past couple of months. Only three times in the past 20 years has it gone this many bars without touching the 20 month exponential moving average. Also, it has been this far above the moving average only three times as well. In all three prior instances, the reversal was at least 20%. Finally, it is rare for it to go so long without a 10% correction. All of this excess is in the process of correcting. No one knows if the current correction will be 10 or 20% or more. The minimum objective on the monthly chart is a test of the moving average, which is now below 1800. That is also below the bottom of the channel. This means that the minimum target would require about a 10% correction.
The monthly chart is in a small pullback bull trend, which is the strongest type of bull trend. This makes a trading range much more likely than a bear trend on the monthly chart. However, once a trading range forms, there might then be enough selling pressure to result in a bigger correction.
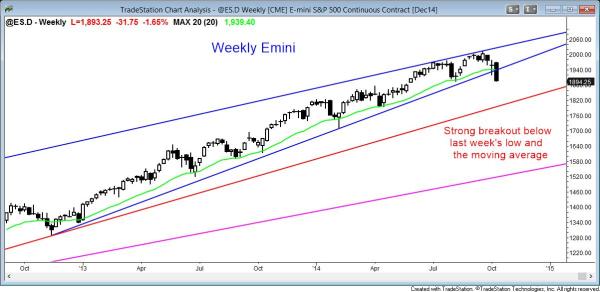
The weekly S&P500 Emini candle chart had a strong bear breakout below the moving average and last week’s low

The weekly Emini broke strongly below last week’s low and created the first sign that the bears might be in control.
The weekly Emini chart finally had a strong bear trend bar after 6 weeks of attempting to reverse. The close was below the moving average and last week’s low, but not below the August low. The bears want a strong breakout below that low and they also want follow-through selling over the following weeks. The Emini has already fallen below one trend line. The next channel bottom is around 1800. It will probably get there over the next couple of months by going down or sideways. The lowest channel line is below 1600 and the Emini will get there as well, but it might take several years to reach that trend line.
The bulls want a double bottom with the August low and weak follow-through selling. They know that a reversal up might then set up a lower high major trend reversal (the right shoulder of a head and shoulders top), but they also know that most tops fail. They need a reversal up and will worry about a head and shoulders top later. Right now, they are worried about a strong bear breakout below the August low. If they can keep the stock market from falling much over the next week or two, they might be able to create a reversal up, or at least maintain the 4 month trading.
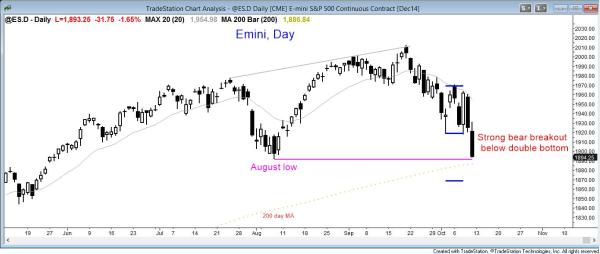
The daily S&P500 Emini candle chart had a strong bear breakout below a double bottom

The daily Emini broke strongly below the double bottom of the past week and is now testing the 200 day moving average.
The daily Emini chart has had very big trend days up and down over the past couple of weeks. Today was a strong bear breakout below the double bottom. The minimum target is a test of the 200 day moving average, which is currently at 1887, just below today’s low. The next target is a measured move down from the double top; that target is around 1870.
The selloff today is testing the bottom of the 4 month trading range, but the breakout was so big that bulls who waited for the close to decide if the breakout would have follow-through have now concluded that it will. This means that there are now many bulls who are looking to exit with a smaller loss. They will use any rally to sell out of their longs. When bulls sell rallies, the market will have a second leg down. This is because the bears will also sell rallies and there will not be enough traders who will buy high above the low. Bulls only do that in bull trends. The bulls now believe the market is either still in a trading range on the daily chart or in a bear trend. In either case, they will sell out of longs on rallies, not initiate new buying, as they would in a bull trend.
Because many bulls will only sell out of their losing longs on a rally, the Emini might have to bounce before there is much follow-through selling. Also, it is at the 200 day moving average. It has not touched that average in almost 2 years. This means that traders who have been waiting for a test of the 200 day moving average to buy will probably buy next week. This could result in the bounce that will be followed by that second leg down.
Finally, it is possible that today is simply a sell vacuum test of the bottom of the 4 month trading range. If so, the Emini might reverse up sharply and work its way to a new all-time high. Since the size of today’s selling was a low probability event, the odds greatly favor at least one more leg down because there will be both bulls and bears selling the first rally. The bulls have a better chance of a reversal if they then get a second reversal up. The daily chart is still in a trading range and arguably still in a bull trend because it is still making higher lows (it has not yet broken the August low). However, the bear breakout today was so strong that the daily chart is always in short. The context (the bars to the left) also supports this. This means that traders should look to sell rallies until there is a strong reversal up or enough buying pressure to support an upside breakout of any trading range that might follow this bear breakout.
Traders can see the end of the day bar-by-bar price action report by signing up for free at BrooksPriceAction.com. I talk about the detailed Emini price action real-time throughout the day in the BrooksPriceAction.com trading room, and a 2 day free trial is available.
When I mention time, it is USA Pacific Standard Time (the Emini day session opens at 6:30 am PST, and closes at 1:15 pm PST). You can read background information on the intraday market reports on the Intraday Market Update page.

