- Market Overview: Weekend Market Analysis
- 30-year Treasury Bond futures
- EURUSD Forex market
- Stock market news
- S&P500 Emini futures
- Monthly Emini chart had bear body in January
- Weekly S&P500 Emini futures chart formed an outside down week at top of bull channel
- Daily S&P500 Emini futures chart broke below 3-month bull channel
Market Overview: Weekend Market Analysis
The SP500 Emini futures should trade lower next week after January had a bear body on the monthly chart, an Emini minor sell signal. Furthermore, last week was outside down on the weekly chart, and the Emini broke below the 3-month bull channel on the daily chart.
Bond futures broke below a 2-year bull channel on the monthly chart. They should trade sideways to down in February.
The EURUSD Forex market formed a bear bar on the monthly chart. There is a wedge rally and a double top. While the 10-month rally has been strong, the EURUSD will probably pull back for a month or two.
30-year Treasury Bond futures
Bond futures on monthly chart broke below the 2020 trading range and a 3-year bull trend line
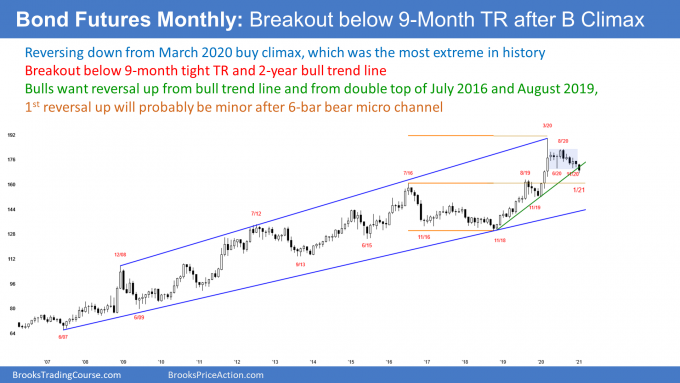
Bond futures on the monthly chart have been selling off for 10 months since the most extreme buy climax in its history. This month broke below the June/November double bottom, which is the bottom of a 9-month trading range. More importantly, it broke below the bull trend line from the November 2018 and January 2020 lows.
However, January closed up from its low. The candlestick has a prominent tail below, making it slightly less bearish. Additionally, the close was only a little below the bull trend line. So, yes, the bears have a breakout, but not an impressive one yet. They need follow-through selling in February.
But as long as the bond market does not break strongly above the August high, traders will assume that the high is in for the next many years. They will look for lower prices. If the bonds rally for a few months, they should form a lower high. The selloff from the August high has been in a tight bear channel. The 1st reversal up from a tight bear is typically minor. Traders expect lower prices.
Support levels are magnets
What are the magnets below? An obvious one is the August 2019 high. The blow-off top during the 1st quarter of 2020 was a breakout. A breakout of what? Of the August 19 high. Traders expect a test of that breakout point.
Markets often stall at support. Traders wonder if the support will hold and the bull trend will resume. If the 10-month selloff is an early bear trend, it should continue down through several support levels. If it is a bear leg in what will become a trading range for a few years, it will probably bounce.
At the moment, while the selloff is not particularly strong, it is strong enough for traders to expect the March 2020 high to hold. They will sell a rally, expecting the selloff to test lower support.
The next support is always the bottom of the most recent buy climax. That is the January 2020 low.
If the selloff continues below that, it could reach the November 2018 low. That is the apex of a 6-year trading range, which is something of a triangle. That trading range came late in a bull trend that lasted for 30 years. When a trading range comes late in a bull trend, it typically is the Final Bull Flag. Traders saw that trading range as an area of agreement for a long time. The 2-year rally to the all-time high put the bonds far above that area of agreement. Once there is a reversal, like in March of 2020, the market tends to work its way back to the area of agreement.
Depending on whether the bonds continue down in a tight bull channel, or bounce and form a trading range or two on the way down, it could take several years for the bond market to reach that 6-year Final Bull flag at around the November 2018 low. But I keep saying that bonds will be lower 5 and 10 years from now, even if they rally a few times before then.
Trends in the bond market often last a decade or two. Therefore, the March 2020 high could be the high for the remainder of your trading career.
EURUSD Forex market
EURUSD monthly chart has a sell signal bar after wedge rally to top of a 6-year trading range
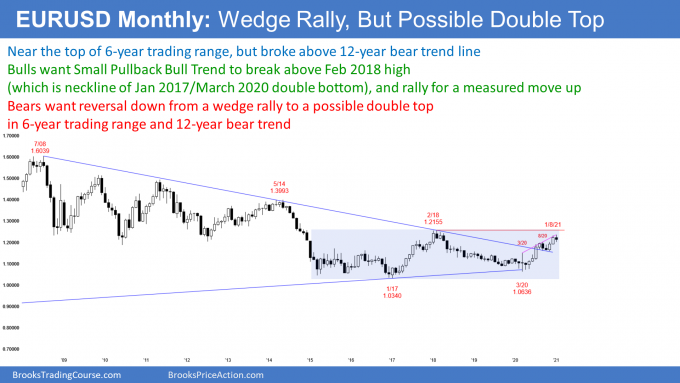
The EURUSD Forex monthly chart has a bear reversal bar in January. It is therefore a sell signal bar. The tail below is fairly big, which is a sign of a weak sell signal bar. It increases the chance that a reversal down will be minor, which means either a bull flag or a trading range instead of a bear trend.
There have been 3 legs up from the March 2020 low, and that makes the yearlong rally a wedge. Also, this is coming just below the February 2018 high, which is the top of a 6-year trading range.
The 2nd leg up of a double top is often a wedge. When there is a reversal down, it typically will have at least a couple legs. Also, it usually tests the nearest support, which is at the bottom of the 2nd leg up. That is the November low at 1.16.
Once the selloff has a couple legs down to support, the bulls begin to look for a buy setup. It could be a double bottom with the November 4 low. But if the selloff reaches that low, the EURUSD will likely go sideways for several bars (months), before the bulls will begin to buy aggressively again. They want to be certain that the selling has stopped.
What happens if the EURUSD continues down below that low? The next support is the March high at 1.15. March was a huge bar, and its high is therefore an important breakout point. Since it was a doji bar, it was neutral. If the selloff gets near a neutral bar, it will probably dip at least a little below that high.
How can the EURUSD go down when TV says it is going up?
What about the uniformly bullish talk on TV? Well, that’s what makes a market. On the monthly chart, the EURUSD Forex market is stalling at the top of a 6-year trading range and the rally is a wedge. When I hear that, I conclude that it will probably reverse down for at least a couple small legs. Nothing is certain, but it will more likely do that, than continue straight up to above the February 2018 high at 1.2555.
There is always a bull case. February does not have to fall below the January low and trigger the sell signal. The rally could simply continue up to above the February 2018 high. Also, if there is a reversal down, it could simply last a month or so. If the trend then resumed, traders would look at the yearlong rally as a Small Pullback Bull Trend instead of as a wedge rally to a double top. But, at the moment, a minor reversal down is more likely than a continuation up.
Stock market news
GameStop is controlled by institutions, not by small guys on Reddit.com
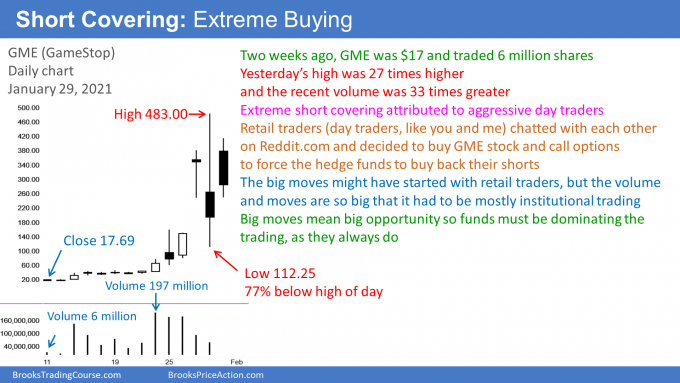
GME, BB, AMC, and other stocks soaring 30 to 100% a day. Yes, short covering, but the news media is misrepresenting this story. They were so enamored with a David and Goliath fantasy, that they are failing to consider any other explanation. A better historical analogy is tulip mania in the 17th century. GME will probably be sideways to down for many months.
They are missing one of the most fundamental points about markets. Markets were created by institutions for their own benefit, and the institutions are quick to seize control. This is true even though the Reddit army temporarily took control of several stocks for several days about a week ago.
Yes, Reddit day traders got the rally going by lots of people with $10,000 accounts buying GME stock and call options. But once a big move begins, the institutions see opportunity and many come in. They are so big that they ultimately retake control. There are never enough ants to take down a herd of elephants. The strong institutions will kill both the ants, and the weak institutions that are short.
Would I be surprised if the short squeeze continued up to 1,000? Yes. Wednesday was so huge that it will be a very important bar for many years. It is a good candidate for the top. The elephants have begun crushing the ants, and there soon will be none left to buy GME.
I believe that much of the trading this week was by institutions. If I were running a high frequency trading firm, I would have told my people early in the week to create appropriate algorithms and start trading. If I were running a short selling shop, I would be telling my traders to short strong rallies, betting against the Reddit army.
The goal of the institutions and the day traders is the same. They both see huge moves and tremendous profit potential. But I bet that by Friday, the institutions were the ones making the money. They are very greedy, smart, aggressive, and rich. I suspect that they were creating a big part of the volume.
Why are the media ignoring the institutions? Because a David and Goliath story gets far more viewers, and the media needs eyeballs to make money. When they see the opportunity to make money, reason does not matter.
Shorts pay interest
There is an interesting point about the shorts in GME. They have to sell borrowed stock. The current interest rate that a short has to pay is over 100% per year for GME. The most a short can make is 100%, and that is when the stock goes to zero. Therefore, the short selling firms are risking more than they hope to make. Why would they do that? Because they believe that the probability is very high that they will make enough money to offset the terrible risk/reward. I, too, believe it is a high probability bet, but I think the math is better for me to trade other things.
Buying a lot of OTM calls makes a stock go up
Many small buyers have been buying far out of the money (OTM) calls, which are relatively cheap because they normally have very little chance of finishing in the money (ITM). The delta is relatively small, often 0.5 (0.5 is big for an OTM stock under normal circumstances) for an extremely OTM call on GME. A delta of 0.5 (50%) means that for every $10 that the stock goes up, the call goes up only $5.
But as the stock goes up, the chance of the call finishing in the money goes up. That means its delta goes up. When a trader buys a far OTM call with a delta of only 0.5, the option selling firm only has to buy 50 shares of stock to hedge. Remember, 1 call controls 100 shares.
If the stock goes up from option selling firms hedging the calls (buying stock) that they sold, or from small traders buying the stock, the OTM calls become less OTM. The probability of them finishing ITM goes up, which means the delta goes up.
If the delta is now 0.8, the option selling firm needs to buy 30 more shares of stock. Therefore, if enough people buy calls, the price of the stock goes up because call selling firms have to buy the stock. It is an interesting feedback loop. Just buying enough OTM calls, hoping the stock will go up, makes the stock go up.
Great for company executives!
Many company executives and board members own a large number of shares of the company’s stock. It is common to have a CEO’s pay tied to the stock’s performance. The assumption is that if a stock goes up, it is because it is being managed well. This kind of pay package incentivizes executives to do a great job. However, with the short squeezes, the executives are doing nothing to contribute to the dramatic increase in the stock’s price, yet are making a fortune.
BlackBerry (BB) is another of these squeezed stocks. CBS has reported that its CEO will get a $90 million bonus if BB trades above $30 for 10 days in a row anytime before the end of 2026. The high of the squeeze so far has been just below $30. BB is still up 300% from where it was 2 months ago.
GameStop has lost $1.3 billion over the past 3 years, and it is closing 20% of its stores. That is why some hedge funds shorted it over the past year. But with the short squeeze, 4 members of the board of directors sold some shares at a huge profit. Other executives from these squeezed stocks are large shareholders, and they are also selling some of their stock at a huge profit during the squeeze.
S&P500 Emini futures
Monthly Emini chart had bear body in January
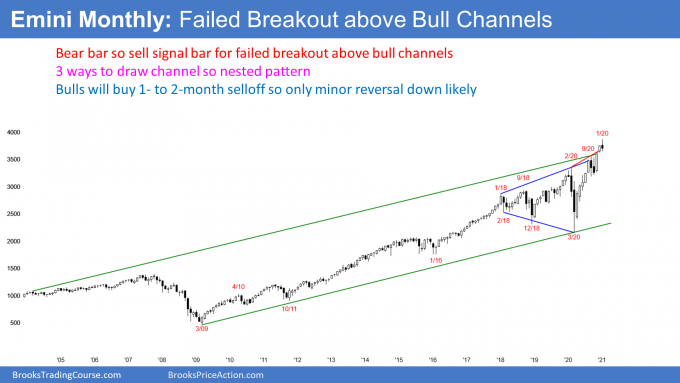
The monthly S&P500 Emini futures chart formed a bear bar in January. Although it did not close on its low, it is still a sell signal bar. This reversal is coming at the top of a 10-year bull channel. There are two other ways to draw a trend channel line as well. Some traders will focus on the one based on the January 2018 and February 2020 highs. Others will see the rally as a wedge top, where the 1st two legs up were in February and September 2020. Whenever there is more than one way to draw a channel, more computers will look for a reversal. With 3 channels, traders expect a pullback and it probably began this month.
I said that this month is not a strong sell signal bar because it did not close on its low. Furthermore, the context is not great. Yes, the reversal is coming at the top of bull channels, which means the Emini is failing at resistance. However, the yearlong bull channel is tight. The 1st reversal down from a tight bull channel typically leads to a bull flag, or a trading range, and not a bear trend. If the Emini enters a trading range for several months, the bears would then have a better chance of a trend reversal down.
Bad bull flag usually limits the extent of rally
I want to bring up another point that I have made several times since October. October was a High 1 bull flag buy signal bar. But it was a bear bar, and September was a bear bar as well. Furthermore, the bull flag was coming in a buy climax since the March low, and 10 years into a bull trend. I have been saying that a breakout in this situation typically only lasts about a couple bars, and then traders expect more of a pullback. The bear bar in January at resistance is consistent with this.
Another example was the pair of bear bars after the January 2018 buy climax. Although the rally that followed lasted 6 bars (months), it only went above the top of the buy climax for 2 months, before reversing down 20%.
How low can the Emini go?
If this is the start of a trading range for a few months, the bottom of the range is often at support. That usually means the bottom of the most recent leg up, which began with the November low at around 3200.
Look at all of the selloffs since 2011. None has lasted more than 3 months. Yes, there was a 35% correction last year, but it only lasted 2 months. Traders will expect a selloff from here to be brief, like all of the others. The Emini will probably fall 10%, like it has done many times since 2011.
Can it fall 35%, like last year? Probably not, at least not without first entering a trading range for several months. And even then, a 35% correction is a 5- to 10- year event. That makes it unlikely in 2021.
What about the bulls?
Does the Emini have to go down? Can’t it continue up, despite the sell signal bar? Of course, but the sell signal bar in a buy climax at resistance makes a minor reversal more likely, than an immediate continuation of the bull trend.
Weekly S&P500 Emini futures chart formed an outside down week at top of bull channel
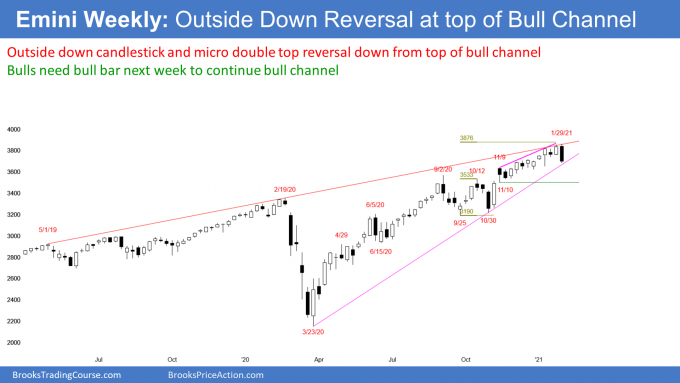
The S&P500 Emini futures on the weekly chart formed an outside down week this week. This week’s high was above last week’s high, and its low was below last week’s low. It is a sell signal bar for next week.
An outside down bar increases the chance of lower prices next week, especially since the bar closed below the low of the prior bar. In addition, this week formed a micro double top with the high from 3 weeks ago. That is also bearish. Moreover, this week reversed down from a break above the top of the channel created by the May 1. 2019 and February 19, 2020 highs. This is a sign of a failed bull breakout.
Despite these bearish factors, the rally from the November 9 low has been in a tight bull channel. A reversal down in a tight bull channel, in a strong bull trend, is typically minor. That means it will probably form a trading range and not a bear trend.
However, a reversal down from a buy climax at resistance usually will have at least a couple small legs down. Also, traders will look for it to test support. The nearest support is the November 9 low, which is where the 3-month bull channel began. That is around 3,500.
If the Emini falls strongly below that, the next target is the bottom of the most recent leg up, which is the October low at around 3,200. That was the 2nd low in a double bottom bull flag.
A bull flag late in a bull trend is often the Final Bull Flag. When there is a reversal down, the bottom of the Final Flag is a magnet. Therefore, if this selloff is relentless, it could continue down to 3,200 over the next couple months.
The entire rally from the March low has been in a Small Pullback Bull Trend. The longest pullback lasted 4 weeks. This could be another small pullback. For example, if next week is a bull bar, it will form a High 1 buy signal bar. Traders will look for a resumption of the bull trend on the following week.
At the moment, it is more likely that the Emini will trade sideways to down for at least a few weeks. It should test the November 10 low at around 3,500. But a strong bull bar next week will make a resumption of the bull trend more likely.
Daily S&P500 Emini futures chart broke below 3-month bull channel
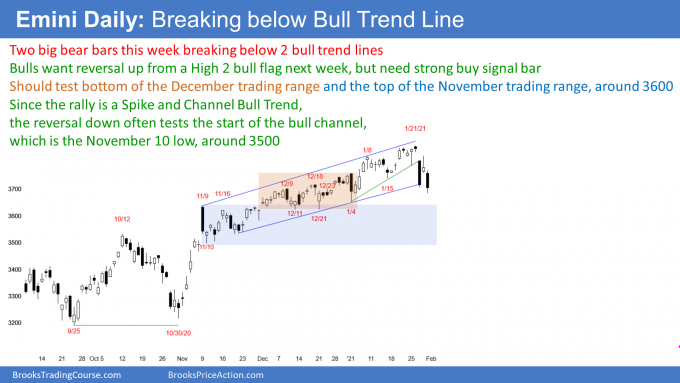
The daily S&P500 Emini futures chart had two big bear days this week. This is the first time since late October, that the bears got two big bear days in the same leg down. Also, the Emini broke strongly below the January bull trend line (green line) and below the 2-month bull trend line. Traders should expect the selloff to continue down to at least the next support level.
That is the bottom of the December trading range (brown box) and the top of the November trading range (blue box), which is around 3,600. Since the rally was a Spike and Channel Bull Trend, the reversal could get down to the start of the channel, as it often does. That is the November 10 low at around 3,500. The market then typically evolves into a trading range for 10 to 20 bars before deciding what it will do next.
But what about the bulls? Everyone on TV is bullish, and traders have been buying every 1- to 3-day selloff since late October. So far, this is just a 3-day selloff in a bull trend. But the two big bear bars, and the break below the bull trend lines, makes this different from the others. Therefore, traders should expect a test down to at least 3,600 within a week or two.
Can the bulls regain control next week, like they have done after every selloff for 3 months? Yes, but they will need at least one strong bull bar early next week. They probably will need at least a couple big bull bars. Without that, traders will expect the selloff to continue down to 3,500 to 3,600, which is about a 10% correction.
Trading Room
Traders can see the end of the day bar-by-bar price action report by signing up for free at BrooksPriceAction.com. I talk about the detailed Emini price action real-time throughout the day in the BrooksPriceAction.com trading room. We offer a 2 day free trial.
Charts use Pacific Standard Time
When I mention time, it is USA Pacific Standard Time (the Emini day session opens at 6:30 am PST, and closes at 1:15 pm PST). You can read background information on the intraday market reports on the Market Update page.


Hi Al,
Thanks for all your insight. On the monthly S&P, despite the bear body being not so strong, is it not a higher high MTR, considering the expanding triangle as well as the ioi.
Because the Emini is far above the February 2020 high, it is a less reliable expanding triangle and a less reliable higher high major trend reversal. This is especially true in a tight bull channel. Every expanding triangle top is a higher high major trend reversal.
When you say the ioi, I believe you are referring to the October ioi as a Final Bull Flag. I look at the current pattern more as a buy climax and a possible Final Bull Flag top.
But with the yearlong rally as strong as it has been, the 1st reversal down will likely be minor. If there is a reversal down, and a test back up, a 2nd reversal would have a better chance of being major.
Thank you Al.. I guess if we start seeing month after month down and bars getting bigger, we may then only get a LHMTR.. Assume that is also possible even though low probablity
Dear Al, I am just writing to say that your work has helped me tremendously to be successful in trading. What you are doing for all of us, it really makes a difference and I want you to know that it is extremely appreciated. Be blessed!
Hi Al, thanks for all the work that you put in. I have a question. I trade daily equity charts for swing trades. Do you feel the market position of the S&P is more important than the daily charts on the equities? In other words if we are entering a possible 2 legged pullback to the bull trend on the S&P is it best to ignore all possible long entries on individual equities until there is more clarity on the S&P?
I prefer to trade like Forrest Gump and not think too much. If I am trading a chart, I ignore all other charts. I assume that anything important is already priced in.
However, if the stock market is selling off strongly and 80% of stocks are down on the day, I rarely will buy any stock. But that is only one day a month.
In the final sentence of your bond commentary you mean the March 2020 high.
Thanks John. I should have caught that in my proofing earlier today. Brain foggy!! : )