Trading Update: Monday November 14, 2022
Emini pre-open market analysis
Emini daily chart
- The Emini closed at the 4,000 big round number on Friday. This is a very important magnet and will likely continue to be for some time.
- The rally over the past two trading days is so climactic that the market may have to go sideways for a couple of days. The Emini may need pullback to relieve the bulls.
- The bulls have done a good job last Thursday and Friday. The breakout the previous week is strong enough that the first reversal down will likely fail and lead to a second leg up.
- The bears will see the breakout as a buy vacuum test of the 4,000 big round number. Next, the bears want to create selling pressure and get a 250-point selloff back to the November 9 low.
- The bears can probably hope for it sideways until they can develop more selling pressure here.
- The bulls still have a couple of targets above, such as the September 12 low.
- Overall, traders should expect at least a couple of legs sideways to up before the bears can take control. The daily chart is still in a trading range, which means traders should expect the bulls to become disappointed soon.
Emini 5-minute chart and what to expect today
- Emini is down 11 points in the overnight Globex session.
- The overnight Globex session has been going sideways inside Friday’s range.
- Since the Globex range is only 20 points, traders know the market is in breakout mode, and there will be at least a measured move up or down of at least 20 points.
- The daily chart may be slightly overbought. This means traders should be prepared to close below the open and disappoint the bulls today.
- If the market continues sideways into the day session, traders should be cautious of limit order trading and wait to see a breakout.
- As always, traders should expect most breakouts to fail on the open. This means traders should wait for 6-12 bars before placing a trade.
- Traders can also consider waiting for a credible swing trade in the form of a double top/bottom or a wedge top/bottom. There is usually an 80% or greater probability of a credible swing trader beginning in the first two hours.
- Overall, traders need to trade the chart before them and only trade what they are comfortable trading.
Friday’s Emini setups

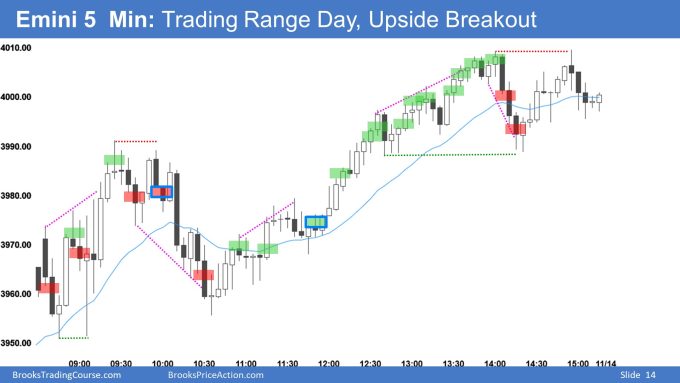
Here are several reasonable stop entry setups from Friday. I show each buy entry with a green rectangle and each sell entry with a red rectangle. Buyers of both the Brooks Trading Course and Encyclopedia of Chart Patterns have access to a much more detailed explanation of the swing trades for each day (see Online Course/BTC Daily Setups).
My goal with these charts is to present an Always In perspective. If a trader was trying to be Always In or nearly Always In a position all day, and he was not currently in the market, these entries would be logical times for him to enter. These therefore are swing entries.
It is important to understand that most swing setups do not lead to swing trades. As soon as traders are disappointed, many exit. Those who exit prefer to get out with a small profit (scalp), but often have to exit with a small loss.
If the risk is too big for your account, you should wait for trades with less risk or trade an alternative market like the Micro Emini.
EURUSD Forex market trading strategies
EURUSD Forex daily chart

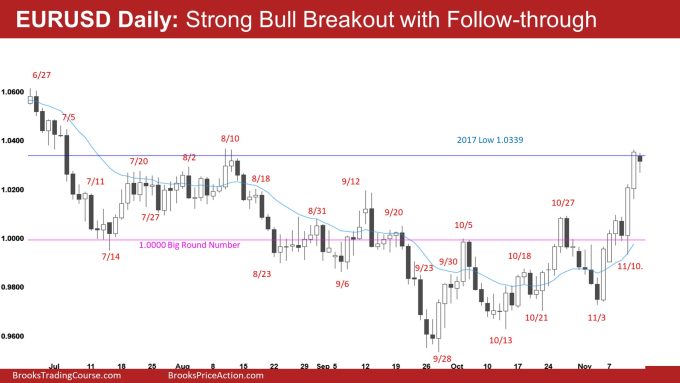
- The EURUSD last week had a strong breakout with follow-through last Thursday and Friday.
- Friday closed back at the 2017 low, a sight of strength by the bulls.
- Last week’s breakout and follow-through are strong enough to lead to a second leg up. The bears are trapped in a losing trade. They will likely use any pullback to buy back shorts. The bulls are trapped out of a winning trade and will use any pullback to find a way to get long.
- While the bears hope this rally is a buy vacuum test of resistance, such as the 2017 low, the momentum up is strong enough that most traders will not be interested in selling until there has been at least a couple of legs up.
- The bears want today to close near its low, reversing most of Friday’s strong bull close. More likely, any selloff today will be seen as profit-taking, and today will not be a big bear bar closing on its low.
- Last Thursday and Friday are climactic enough that the market may have to go sideways for a few days to relieve the bulls.
- Overall, the EURSUD has been in a broad bear channel on the daily chart for over 18 months. The odds favor the bear channel converting into a trading range, which is what is happening right now.
Summary of today’s S&P Emini futures price action and what to expect tomorrow

Al created the SP500 Emini charts.
End of day review
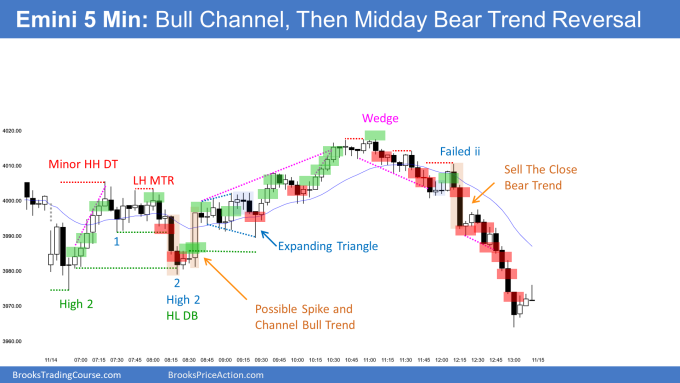
- Today was a Bull Channel that led to a Midday Bear Trend Reversal.
- The bulls formed 7 bar bull microchannel around 7:15 AM PT. Although the rally had many tails, it was big enough to increase the odds of the day being a trading range or a bull-trend day.
- The market went sideways to down and tested the lows around 8:20 AM PT. At this point, the market formed a big move up, followed by a bit more down, so sideways was most likely.
- The market rallied, forming a spike and channel bull trend that ended around 11:00 AM. The market reversed in the final 2 hours of the day and created a sell-the-close market, going into the close.
- I will make a video over the day soon.
See the weekly update for a discussion of the price action on the weekly chart and for what to expect going into next week.
Trading Room
Traders can see the end of the day bar-by-bar price action report by signing up for free at BrooksPriceAction.com. Al talks about the detailed S&P Emini futures price action real-time throughout the day in the BrooksPriceAction.com on trading room days. We offer a 2 day free trial.
Charts use Pacific Time
When times are mentioned, it is USA Pacific Time. The Emini day session charts begin at 6:30 am PT and end at 1:15 pm PT which is 15 minutes after the NYSE closes. You can read background information on the market reports on the Market Update page.

