Trading Update: Tuesday January 16, 2024
S&P Emini pre-open market analysis
Emini daily chart
- The Emini is near the March 2022 magnet and will probably have to reach it in the next couple of days.
- The Emini is going sideways at the December 28th high of last year. The bears want a downside breakout and test of the neckline (January low).
- The bulls want an upside breakout above December 28th and a test of the March 2022 high.
- The market is so close to the March 2022 high that it will likely have to get there. This means that bears may hesitate to sell right below an important magnet (March 2022) and instead wait to sell at the March 2022 high.
- The bulls will see the month-long trading range as a bull flag, leading to trend continuation.
- The bears are hopeful that a breakout above the month-long trading range will lead to a final flag, creating a reversal down.
- At the moment, the odds favor a test of the March 2022 high, which is around 40 points above.
Emini 5-minute chart and what to expect today
- Emini is down 16 points in the overnight Globex session.
- The Emini has gone sideways for several hours after forming a broach bear channel in the overnight Globex session.
- Traders should pay attention to the opening of the day as today will probably have a lot of trading range price action, making the open a logical magnet.
- The odds favor a trading range open, which means that most traders should consider waiting for 6-12 bars before placing a trade.
- Most traders should try to catch the open swing that often begins before the end of the second hour. It is common for the open swing to start after forming a double top/bottom or a wedge top/bottom.
Friday’s Emini setups

Richard created the SP500 Emini chart.
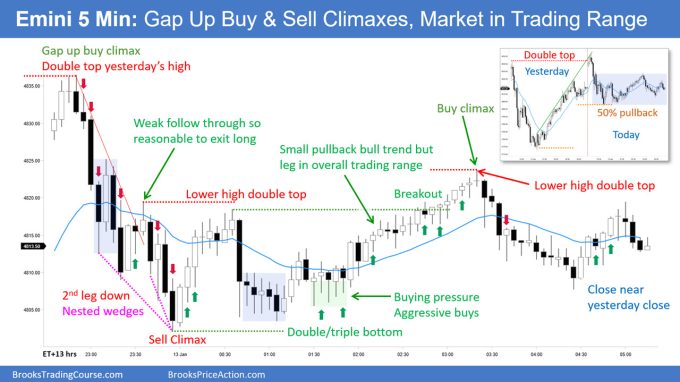
Here are reasonable stop entry setups from Friday (before US holiday break). I show each buy entry bar with a green arrow and each sell entry bar with a red arrow. Buyers of both the Brooks Trading Course and Encyclopedia of Chart Patterns have access to a near 4-year library of more detailed explanations of swing trade setups (see Online Course/BTC Daily Setups). Encyclopedia members get current daily charts added to Encyclopedia.
My goal with these charts is to present an Always In perspective. If a trader was trying to be Always In or nearly Always In a position all day, and he was not currently in the market, these entries would be logical times for him to enter. These therefore are swing entries.
It is important to understand that most swing setups do not lead to swing trades. As soon as traders are disappointed, many exit. Those who exit prefer to get out with a small profit (scalp), but often have to exit with a small loss.
If the risk is too big for your account, you should wait for trades with less risk or trade an alternative market like the Micro Emini.
EURUSD Forex market trading strategies
EURUSD Forex daily chart
- The EURUSD is attempting to get a second leg down after the selloff that began at the end of December.
- The bears want a bear breakout of the tight trading range and a test of the December low.
- The bulls hope that today’s breakout fails and leads to a failed breakout of the tight trading range. Next, the bulls will want a reversal up and test of the December high.
- At the moment, today is enough of a surprise that it will probably get at least a small second leg down.
- The bears need today to close on its low and, ideally, for tomorrow to form a strong follow-through bar.
Summary of today’s S&P Emini price action

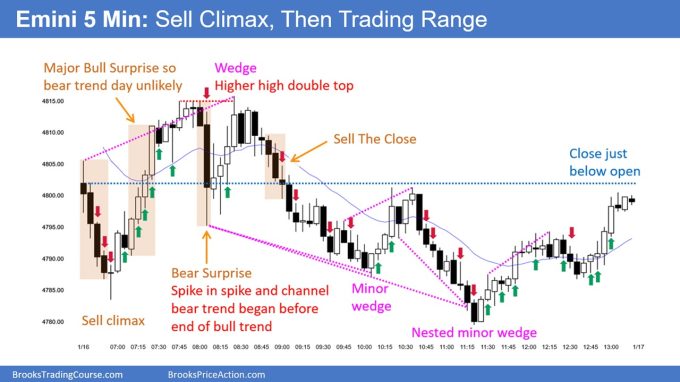
Al created the SP500 Emini chart.
End of day video review
End Of Day Review was presented in the Trading Room today. See below for details on how to sign up. Pilot coaching session today at 2pm PT / 5pm PT. See top of blog.
See the weekly update for a discussion of the price action on the weekly chart and for what to expect going into next week.
Trading Room
Al Brooks and other presenters talk about the detailed Emini price action real-time each day in the BrooksPriceAction.com trading room days. We offer a 2 day free trial.
Charts use Pacific Time
When times are mentioned, it is USA Pacific Time. The Emini day session charts begin at 6:30 am PT and end at 1:15 pm PT which is 15 minutes after the NYSE closes. You can read background information on the market reports on the Market Update page.


Hello Richard, Regarding Friday’s (Jan 12th) Emini Setup, Bar 17 was labeled as sell climax and Bar 56 was labeled as buy climax. B17 was a mid sized bar, and B56 was extremely tiny. I have difficulty time to view them as sell/buy climax bars. Would you please expand your theory and help me understand the significance of these two bars? Thank you so much!
Forgive me if I’m missing something. But the high of March 2022 on the Emini was 4631. Can you clarify? Thank you
• The charts from the daily and weekly analysis are TradeStation charts. If you’re on a different trading platform than TradeStation, the point values and magnets are frequently substantially different and probably answers your clarity question.
• I’m not on TradeStation and also show the March 2022 high at 4631. The March 2022 high was tested on the July 2023 high at 4633.50 (July 27, 2023 bar). An almost perfect double top (2.5 point differential), which became a wedge double top bear flag that led to the bear trend from July 27, 2023 to October 27, 2023 on the daily (and weekly charts). The short, which was a wedge, double top (March 2022 and July 2023) bear flag did not look as reasonable on the TradeStation chart as other charts.
• It’s difficult to comprehend how data from one source (The CME) can produce completely different (chart) stories for the identical trading symbol but the noticeable variations exist. Variations in different trading platforms’ calculations for settlements and contract changes do not seem like a reasonable explanation for greater than 20, 50, over 100 point variations in point values between chart data on different trading platforms. Same issue with moving averages (exponential and simple); substantially different as well between TradeStation and my charts.
• Even when I filter my charts in different ways for settlement / no settlement, contract changes / no contract changes, I still can’t produce a chart that looks like the TradeStation charts. I assume trading platforms can tweak their software to present whatever chart illustration it wants you to see and possibly profit from the data variations (it is not illegal to profit from arbitrage). Up to each trader to decide what trading platform frustrations they can live with and which are most accurate.
• It’s confusing because I like the daily and weekly analysis but I have to ignore the numbers and magnets and go with what I mark up on my charts. I just note the different chart illustrations between trading platforms for the identical symbol and follow Al’s rule, trade the chart in front of you. Sucks trading the identical symbol in parallel universes that tell completely different (chart) stories. Confusing to say the least.
I find using the cash S&P500 index for longer term charts avoids the issues of trading sessions, tick filtering and contract rollovers.