Trading Update: Wednesday March 15, 2023
Emini pre-open market analysis
Emini daily chart
- The Emini rallied yesterday and reached the March 2nd low. This was an obvious magnet for the market to test, especially since the daily chart is in a trading range. Yesterday is an Emini Low 1 short. However, since the market is in a trading range, there are probably buyers below.
- Some bulls bought the March 2nd low and scaled in lower. Those bulls were likely sufficiently disappointed with the two-bar bear breakout that ended on March 10th.
- These bulls that bought the March 2nd low did not expect such a deep drawdown, therefore most of the bulls would be happy to exit back at the March 2nd low. This means that March 2nd will act as resistance.
- Some bears did not sell the breakout below March 2nd, and they missed out on a brief selloff. These bears will also be interested in selling a test of the March 2nd low.
- Often, when you get breakouts within trading ranges that are strong enough for a 2nd leg (March 10th), it is usually better to sell the pullback test of the breakout point (March 2nd), which is what happened yesterday.
- Breakout points (gaps) typically close in trading ranges, meaning the pullbacks after breakouts are often deep. This means that a trader can usually wait and not be in such as rush to enter.
- The bears still hope that the selloff down to March 13th is strong enough for a 2nd leg down.
- The bulls hope the past two-day rally is strong enough to convince traders that the market is in a trading range. They want the bears to buy back shorts on any test of the March 13th low, which would create a double bottom.
- Even if the bears can get a breakout below March 13th and a second leg down, it will likely be brief and be met with buyers.
- The market formed an Emini Low 1 short below yesterday, and it is a bull doji. This means there are probably more buyers below yesterday’s low than sellers.
- Overall, trading ranges typically disappoint traders. Just like the market disappointed the bulls who bought the May 2nd low, the bears that sold the May 10th breakout are disappointed as well. The bears that are short may use any test of the May low to exit and buy back shorts.
- This means that the market is probably going to go sideways soon.
Emini 5-minute chart and what to expect today
- Emini is down 65 points in the overnight Globex session.
- The Globex market was in a tight trading range that broke out to the downside in the early morning hours.
- At the moment, the Globex market is testing the March 13th lows. However, traders should expect disappointment today and the bears to scalp out.
- Today will have a big gap down. This means traders should expect a test of the moving average and sideways trading on the open.
- There is only a 20% chance that the open will form a successful bull trend from the open and reverse the gap. This means traders should expect a trading range open and for the bears to get a swing down in the first 1-2 hours.
- Typically, when you get a gap on the open, there is a trading move in the direction of the gap. A gap is a breakout, and breakouts typically have small 2nd legs. This means traders should expect a small 2nd leg after the gap.
- As I often say, most traders should avoid trading the first 6-12 bars of the day unless they are comfortable with fast decisions and trading with limit orders.
- Most traders should look for a swing trade, which often forms before the end of the second hour. A typical pattern to look for is a double top/bottom or a wedge top/bottom.
Yesterday’s Emini setups

Al created the SP500 Emini charts.
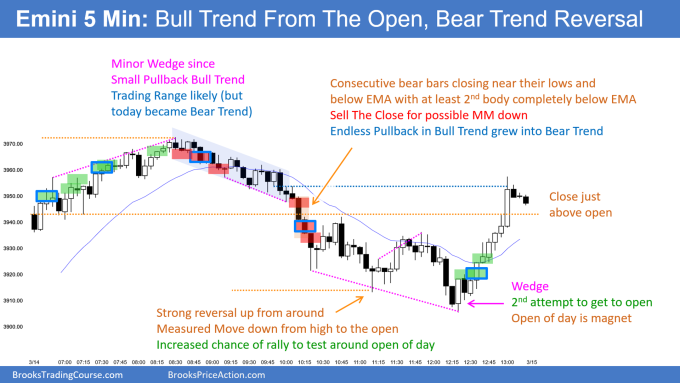
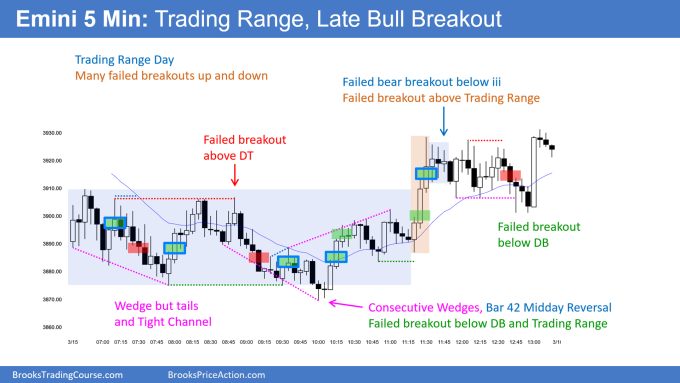
Here are several reasonable stop entry setups from yesterday. I show each buy entry with a green rectangle and each sell entry with a red rectangle. Buyers of both the Brooks Trading Course and Encyclopedia of Chart Patterns have access to a near 4-year library of more detailed explanations of swing trade setups (see Online Course/BTC Daily Setups). Encyclopedia members get current daily charts added to Encyclopedia.
My goal with these charts is to present an Always In perspective. If a trader was trying to be Always In or nearly Always In a position all day, and he was not currently in the market, these entries would be logical times for him to enter. These therefore are swing entries.
It is important to understand that most swing setups do not lead to swing trades. As soon as traders are disappointed, many exit. Those who exit prefer to get out with a small profit (scalp), but often have to exit with a small loss.
If the risk is too big for your account, you should wait for trades with less risk or trade an alternative market like the Micro Emini.
EURUSD Forex market trading strategies
EURUSD Forex daily chart

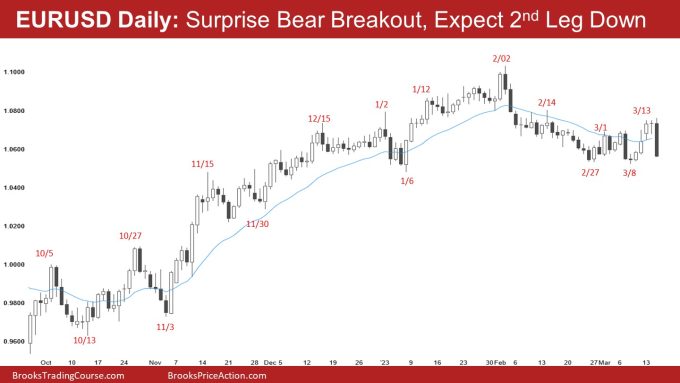
- The EURUSD managed to get two bars completely above the 20-period moving average (blue line).
- This was enough to make the market enter a trading range. However, the bears got 22 out of 23 recent closes below the moving average. This is a sign of strong selling, and the market will likely have to enter a trading range before the market can go higher.
- The bears now have a big bear trend bar today. So far, today is enough of a surprise to get at least a small 2nd leg down. However, it forces traders to sell low in a tight trading range. This will likely cause confusion and disappointment as limit order bears who sold yesterday’s close scalp out. Bulls will probably be buyers below the March low, betting they can make at least a scalp.
- If the bears are going to get a strong downside breakout, they need to make today’s close on its low and further trap the bulls. Next, the bears need to get follow-through selling. Otherwise, the market will probably get a small 2nd leg down (after today’s bar) and then continue sideways.
Summary of today’s S&P Emini futures price action and what to expect tomorrow

Al created the SP500 Emini charts.
End of day review
- Live stream video trial replacement of end of day review coming soon.
See the weekly update for a discussion of the price action on the weekly chart and for what to expect going into next week.
Trading Room
Al Brooks and other presenters talk about the detailed Emini price action real-time each day in the BrooksPriceAction.com trading room days. We offer a 2 day free trial.
Charts use Pacific Time
When times are mentioned, it is USA Pacific Time. The Emini day session charts begin at 6:30 am PT and end at 1:15 pm PT which is 15 minutes after the NYSE closes. You can read background information on the market reports on the Market Update page.


Thanks Brad, for your sobering clarity during these tumultuous times!
Agree. These are so well written, that I am constantly refreshing mid-day for the update. Very helpful for confirmation of feelings or differing view than I might have. Thanks Brad.