Trading Update: Wednesday February 7, 2024
S&P Emini pre-open market analysis
Emini daily chart
- The Emini triggered Monday’s inside bar, which was a high 1 buy signal bar. The Emini is likely going to reach 5,000 today.
- The bulls are hopeful that the market will be unable to escape the magnet of 5,000, which is not far above.
- The market came within 2 points of the big round number and pulled back. It is common for the market to get close to an important magnet, pull back, and then go beyond the market. This is what might happen over the next day or two.
- The bulls are still in control of the market, which means the best the bars can expect is a trading range with buyers not far below.
- This means that bulls will likely buy near the moving average.
- For the bears to take control of the market, they will first have to create enough selling pressure for traders to become convinced that the market is now in a trading range and no longer in a bull trend.
- Once the market is in a trading range, the bears will have a chance to make the market evolve into a bear trend.
- Overall, the market will probably continue to go sideways and test closer to the 5,000 big round number.
Emini 5-minute chart and what to expect today
- Emini is up 20 points in the overnight Globex session.
- The Globex market has gone sideways for most of the overnight session and recently broke out to the upside.
- At the time of writing this, the Emini is 5 points away from the 5,000 big round number. This is close enough to the round number that the market will probably be unable to escape the gravitational pull of the magnet.
- Traders should pay close attention to the 5,000 round number as it will likely be a magnet on the open.
- Traders should consider the possibility of the market going sideways at the round number for several hours today.
- As always, traders should assume that the open will have a lot of trading range price action. This means that most traders should consider not trading for the first 6 – 12 bars unless they can make quick decisions since most breakouts on the open fail.
- Most days have an opening swing that often begins before the end of the second hour after the formation of a double top/bottom or a wedge top/bottom. The opening swing is important because it typically lasts two legs and two hours, providing great risk/reward. This meant that traders should focus on trying to catch the opening swing.
Yesterday’s Emini setups

Al created the SP500 Emini charts.
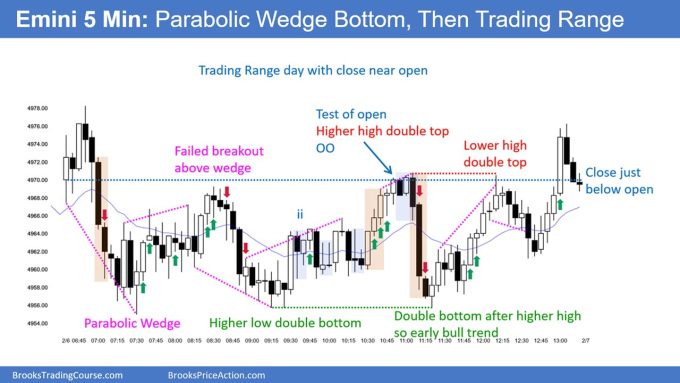
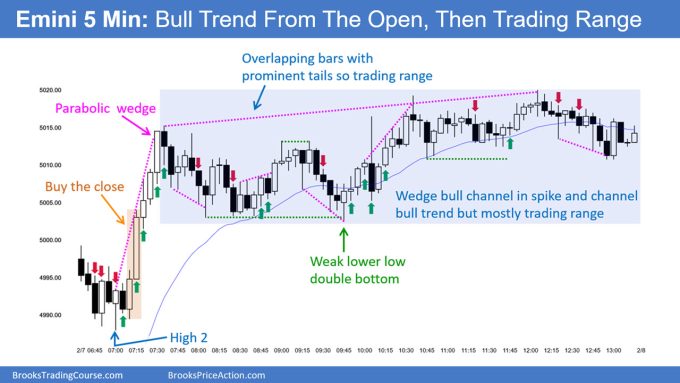
Here are reasonable stop entry setups from yesterday. I show each buy entry bar with a green arrow and each sell entry bar with a red arrow. Buyers of both the Brooks Trading Course and Encyclopedia of Chart Patterns have access to a near 4-year library of more detailed explanations of swing trade setups (see Online Course/BTC Daily Setups). Encyclopedia members get current daily charts added to Encyclopedia.
My goal with these charts is to present an Always In perspective. If a trader was trying to be Always In or nearly Always In a position all day, and he was not currently in the market, these entries would be logical times for him to enter. These therefore are swing entries.
It is important to understand that most swing setups do not lead to swing trades. As soon as traders are disappointed, many exit. Those who exit prefer to get out with a small profit (scalp), but often have to exit with a small loss.
If the risk is too big for your account, you should wait for trades with less risk or trade an alternative market like the Micro Emini.
EURUSD Forex market trading strategies
EURUSD Forex daily chart
- The EURUSD formed a bull bar yesterday, which is a bad follow-through after the recent downside breakout.
- The bulls see the recent two consecutive bull bars as a vacuum test of the December low.
- The Bulls are hopeful that the traders who bought above the February 1st bull bar are willing to buy more lower. This would increase the odds of a rally back to the February 1st high and allow the bulls who bought above the February 1st outbreak on their first entry with a profit on their second.
- Although the bulls did a good job getting a bull bar yesterday, it is a weak buy signal bar. This increases the odds of sellers above and the bears getting a 2nd leg down.
- The bulls will likely need a second entry buy or a series of consecutive bull bars.
Summary of today’s S&P Emini price action

Al created the SP500 Emini charts.
End of day video review
See the weekly update for a discussion of the price action on the weekly chart and for what to expect going into next week.
Trading Room
Al Brooks and other presenters talk about the detailed Emini price action real-time each day in the BrooksPriceAction.com trading room days. We offer a 2 day free trial.
Charts use Pacific Time
When times are mentioned, it is USA Pacific Time. The Emini day session charts begin at 6:30 am PT and end at 1:15 pm PT which is 15 minutes after the NYSE closes. You can read background information on the market reports on the Market Update page.


Bars 8 & 9 today were very interesting. Bar 8 started as a failed H2 then reversed and became a failed failed H2 which likely contributed to the size of bar 9.
I believe the H2 only is a failure if price goes below the low of 6 which it did not. I think it’s better to view it as simply a successful H2 swing long as swing stops are below 6. Bar 5 was a failed L2, when 9 broke out.
Bar 5 was the H1. When bar 6 went below its low it setup the H2. Bar 7 triggered the H2 but then became a bear bar. When bar 8 went below 7 it was a failure but then reversed and became outside up so the failed H2 failed.
Most bulls won’t see it as a failure unless it goes beyond the signal bar. That’s all I’m saying. You’re identifying it as a double negative which is essentially just a positive. It’s just a successful swing stop long H2 setup if you used the proper stop
hey brad more of a question than comment i was enjoying your
reviews of course material up to segment 3. are there any more segments planned?
Richard said in the Coaching Forum that more sessions are in the works.